Estimated Value: $642,000 - $777,993
5
Beds
4
Baths
2,218
Sq Ft
$327/Sq Ft
Est. Value
About This Home
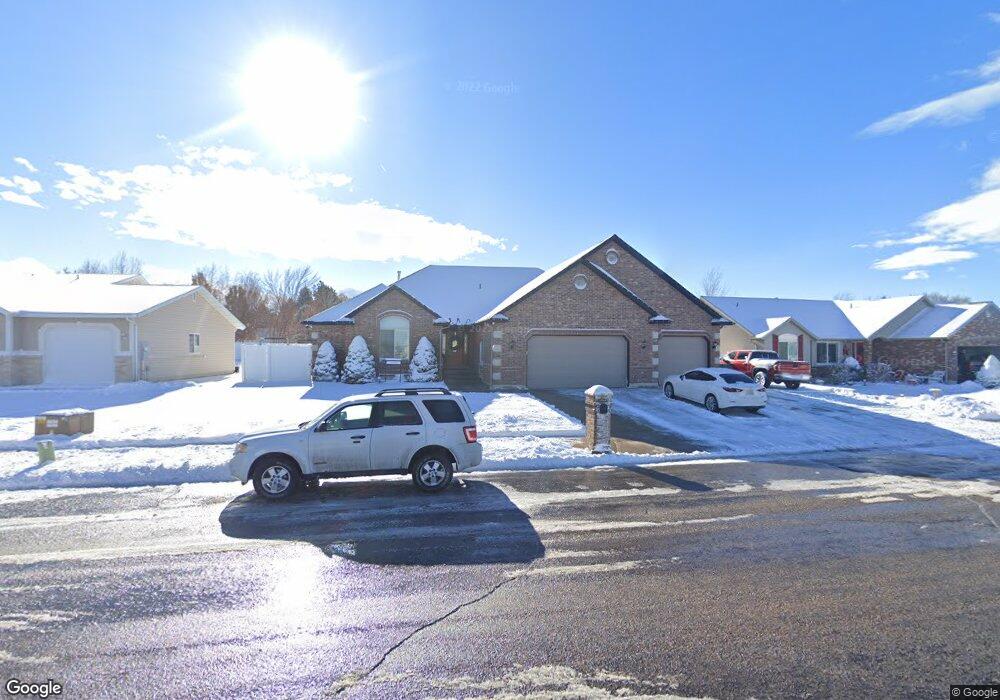
This home is located at 2299 W 4150 S, Roy, UT 84067 and is currently estimated at $725,998, approximately $327 per square foot. 2299 W 4150 S is a home located in Weber County with nearby schools including North Park School, Sand Ridge Junior High School, and Roy High School.
Ownership History
Date
Name
Owned For
Owner Type
Purchase Details
Closed on
Nov 13, 2012
Sold by
Haney Scott and Haney Cindy K
Bought by
Haney Scott A and Haney Cindy K
Current Estimated Value
Home Financials for this Owner
Home Financials are based on the most recent Mortgage that was taken out on this home.
Original Mortgage
$225,000
Outstanding Balance
$155,185
Interest Rate
3.35%
Mortgage Type
New Conventional
Estimated Equity
$570,813
Purchase Details
Closed on
Oct 31, 2005
Sold by
Regency Development Lc
Bought by
Haney Scott and Haney Cindy K
Home Financials for this Owner
Home Financials are based on the most recent Mortgage that was taken out on this home.
Original Mortgage
$226,400
Interest Rate
5.74%
Mortgage Type
Construction
Purchase Details
Closed on
May 11, 2005
Sold by
The Karras Co Inc
Bought by
Karras Nolan and Karras Lynda
Create a Home Valuation Report for This Property
The Home Valuation Report is an in-depth analysis detailing your home's value as well as a comparison with similar homes in the area
Home Values in the Area
Average Home Value in this Area
Purchase History
| Date | Buyer | Sale Price | Title Company |
|---|---|---|---|
| Haney Scott A | -- | Backman Title Services Ltd | |
| Haney Scott | -- | Mountain View Title | |
| Karras Nolan | -- | Security Title |
Source: Public Records
Mortgage History
| Date | Status | Borrower | Loan Amount |
|---|---|---|---|
| Open | Haney Scott A | $225,000 | |
| Closed | Haney Scott | $226,400 |
Source: Public Records
Tax History Compared to Growth
Tax History
| Year | Tax Paid | Tax Assessment Tax Assessment Total Assessment is a certain percentage of the fair market value that is determined by local assessors to be the total taxable value of land and additions on the property. | Land | Improvement |
|---|---|---|---|---|
| 2025 | $4,676 | $776,956 | $163,744 | $613,212 |
| 2024 | $4,554 | $419,099 | $90,059 | $329,040 |
| 2023 | $4,499 | $415,250 | $89,484 | $325,766 |
| 2022 | $4,549 | $430,100 | $72,727 | $357,373 |
| 2021 | $3,517 | $546,000 | $86,624 | $459,376 |
| 2020 | $3,102 | $440,000 | $86,624 | $353,376 |
| 2019 | $3,084 | $413,000 | $66,251 | $346,749 |
| 2018 | $3,198 | $406,000 | $66,251 | $339,749 |
| 2017 | $3,076 | $367,000 | $65,259 | $301,741 |
| 2016 | $2,744 | $175,286 | $33,392 | $141,894 |
| 2015 | $2,571 | $168,633 | $33,392 | $135,241 |
| 2014 | $2,596 | $168,633 | $29,020 | $139,613 |
Source: Public Records
Map
Nearby Homes
- 4164 S 2400 W
- 4110 S 2275 W
- 4073 S 2175 W
- 4328 S 2175 W
- 4205 S 2075 W
- 3965 S 2225 W
- 4220 S 2075 W
- 2263 W 4400 S
- 2070 W 4000 S
- 2096 W 3950 S
- 2015 W 4225 S
- 2050 W 4000 S
- 4118 Westlake Dr
- 2082 W 4450 S
- 3860 Midland Dr Unit C10
- 3860 Midland Dr Unit B32
- 1959 3985 St S Unit 2
- 3923 S 1975 W Unit 15
- 2259 W 4525 S
- 2642 W 4400 S