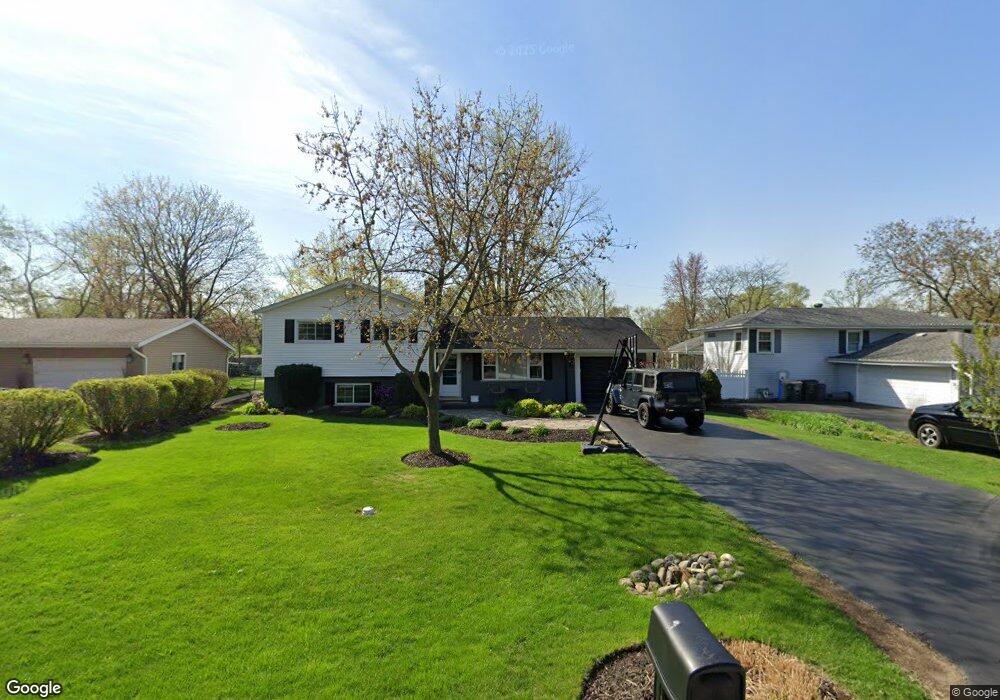
22W547 Juniper Ln Glen Ellyn, IL 60137
Estimated Value: $377,995 - $512,000
3
Beds
2
Baths
1,070
Sq Ft
$396/Sq Ft
Est. Value
About This Home
This home is located at 22W547 Juniper Ln, Glen Ellyn, IL 60137 and is currently estimated at $423,749, approximately $396 per square foot. 22W547 Juniper Ln is a home located in DuPage County with nearby schools including Arbor View Elementary School, Glen Crest Middle School, and Glenbard South High School.
Ownership History
Date
Name
Owned For
Owner Type
Purchase Details
Closed on
Jul 24, 2008
Sold by
Taylor Michael R and Taylor Pamela A
Bought by
Micek Jason and Micek Talia T
Current Estimated Value
Home Financials for this Owner
Home Financials are based on the most recent Mortgage that was taken out on this home.
Original Mortgage
$219,920
Outstanding Balance
$144,937
Interest Rate
6.5%
Mortgage Type
Purchase Money Mortgage
Estimated Equity
$278,812
Purchase Details
Closed on
Feb 25, 2000
Sold by
Shields David A
Bought by
Taylor Michael R and Taylor Pamela A
Home Financials for this Owner
Home Financials are based on the most recent Mortgage that was taken out on this home.
Original Mortgage
$160,650
Interest Rate
8.39%
Purchase Details
Closed on
May 4, 1997
Sold by
Olson Robert E and Olson Mary L
Bought by
Shields David A
Home Financials for this Owner
Home Financials are based on the most recent Mortgage that was taken out on this home.
Original Mortgage
$123,250
Interest Rate
9.99%
Create a Home Valuation Report for This Property
The Home Valuation Report is an in-depth analysis detailing your home's value as well as a comparison with similar homes in the area
Home Values in the Area
Average Home Value in this Area
Purchase History
| Date | Buyer | Sale Price | Title Company |
|---|---|---|---|
| Micek Jason | $275,000 | Atg | |
| Taylor Michael R | $178,500 | -- | |
| Shields David A | $145,000 | Attorneys Title Guaranty Fun |
Source: Public Records
Mortgage History
| Date | Status | Borrower | Loan Amount |
|---|---|---|---|
| Open | Micek Jason | $219,920 | |
| Previous Owner | Taylor Michael R | $160,650 | |
| Previous Owner | Shields David A | $123,250 |
Source: Public Records
Tax History Compared to Growth
Tax History
| Year | Tax Paid | Tax Assessment Tax Assessment Total Assessment is a certain percentage of the fair market value that is determined by local assessors to be the total taxable value of land and additions on the property. | Land | Improvement |
|---|---|---|---|---|
| 2024 | $6,097 | $93,669 | $25,943 | $67,726 |
| 2023 | $5,786 | $86,220 | $23,880 | $62,340 |
| 2022 | $5,586 | $82,060 | $22,580 | $59,480 |
| 2021 | $5,445 | $80,110 | $22,040 | $58,070 |
| 2020 | $5,476 | $79,360 | $21,830 | $57,530 |
| 2019 | $5,312 | $77,260 | $21,250 | $56,010 |
| 2018 | $4,489 | $65,530 | $20,020 | $45,510 |
| 2017 | $4,131 | $63,110 | $19,280 | $43,830 |
| 2016 | $4,053 | $60,590 | $18,510 | $42,080 |
| 2015 | $4,004 | $57,800 | $17,660 | $40,140 |
| 2014 | $4,243 | $60,050 | $17,370 | $42,680 |
| 2013 | $4,103 | $60,230 | $17,420 | $42,810 |
Source: Public Records
Map
Nearby Homes
- 22W506 Arbor Ln
- 22W633 Burr Oak Dr
- 22W425 Arbor Ln
- 22W351 Birchwood Dr
- 3S138 Park Blvd
- 3S240 Burr Oak Dr
- 23W111 Mulberry Ln
- 2254 Blacksmith Dr
- 2S651 Ashley Dr
- 2S630 Devonshire Ln
- 22W041 Pinegrove Ct
- 23W160 Woodcroft Dr
- 2S365 Milton Ave
- 1888 Cheshire Ln
- 1260 Windsor Dr
- 4542 Basswood Dr
- 21W745 Glen Valley Dr
- Lots 02,03,12,13,14, Southport Ave
- 1002 Ogden Ave
- 470 Fawell Blvd Unit 510
- 22W541 Juniper Ln
- 22W544 Juniper Ln
- 22W556 Juniper Ln
- 22W531 Juniper Ln
- 22W566 Juniper Ln
- 3S431 Osage Dr
- 22W521 Juniper Ln Unit 2
- 22W564 Juniper Ln
- 3S362 Juniper Ln
- 22W530 Burr Oak Dr
- 22W540 Burr Oak Dr
- 22W541 Sycamore Dr
- 22W520 Burr Oak Dr
- 22W544 Burr Oak Dr
- 22W510 Burr Oak Dr
- 22W549 Sycamore Dr
- 3S361 Osage Dr
- 22W507 Sycamore Dr
- 22W502 Burr Oak Dr
- 22W502 Burr Oak Dr