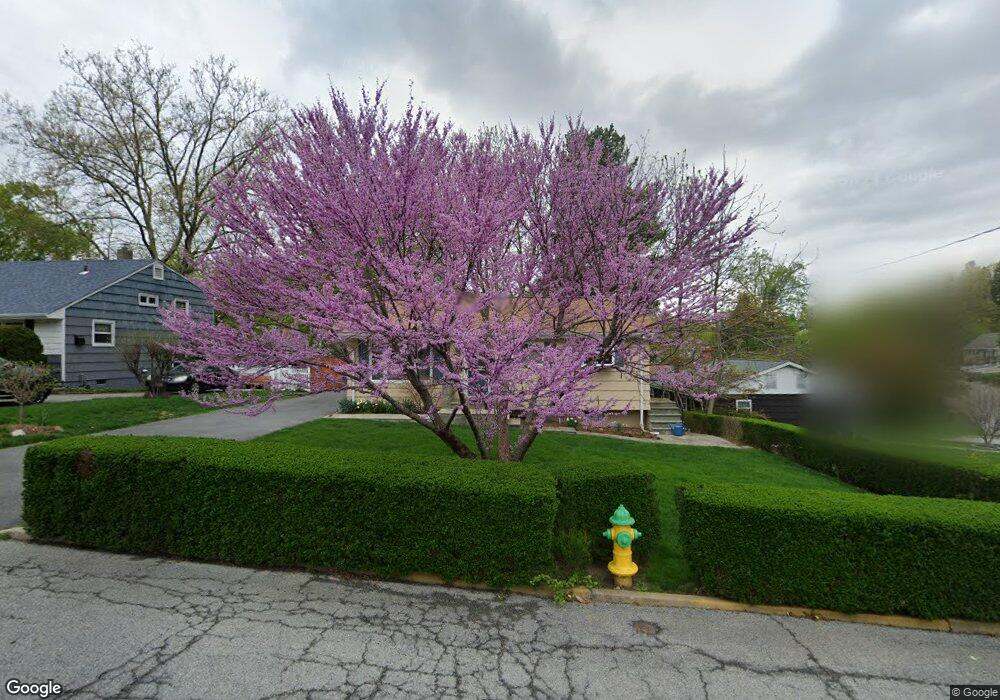
23 3rd Ave Ossining, NY 10562
Estimated Value: $523,022 - $611,000
3
Beds
1
Bath
1,052
Sq Ft
$541/Sq Ft
Est. Value
About This Home
This home is located at 23 3rd Ave, Ossining, NY 10562 and is currently estimated at $568,756, approximately $540 per square foot. 23 3rd Ave is a home located in Westchester County with nearby schools including Park School, Roosevelt Elementary School, and Brookside Elementary School.
Ownership History
Date
Name
Owned For
Owner Type
Purchase Details
Closed on
Jun 17, 2025
Sold by
Beda George A and Layne Alice
Bought by
George Beda Revocable Trust and Alice Layne Revocable Trust
Current Estimated Value
Purchase Details
Closed on
Apr 29, 2004
Sold by
Bancroft Drew and Bancroft Carol
Bought by
Beda George A and Layne Alice
Home Financials for this Owner
Home Financials are based on the most recent Mortgage that was taken out on this home.
Original Mortgage
$300,000
Interest Rate
6.2%
Mortgage Type
Purchase Money Mortgage
Create a Home Valuation Report for This Property
The Home Valuation Report is an in-depth analysis detailing your home's value as well as a comparison with similar homes in the area
Home Values in the Area
Average Home Value in this Area
Purchase History
| Date | Buyer | Sale Price | Title Company |
|---|---|---|---|
| George Beda Revocable Trust | -- | None Listed On Document | |
| Beda George A | $375,000 | -- |
Source: Public Records
Mortgage History
| Date | Status | Borrower | Loan Amount |
|---|---|---|---|
| Previous Owner | Beda George A | $300,000 |
Source: Public Records
Tax History
| Year | Tax Paid | Tax Assessment Tax Assessment Total Assessment is a certain percentage of the fair market value that is determined by local assessors to be the total taxable value of land and additions on the property. | Land | Improvement |
|---|---|---|---|---|
| 2024 | $12,982 | $427,800 | $153,400 | $274,400 |
| 2023 | $12,579 | $403,000 | $153,400 | $249,600 |
| 2022 | $12,427 | $370,000 | $153,400 | $216,600 |
| 2021 | $10,862 | $330,400 | $153,400 | $177,000 |
| 2020 | $12,357 | $330,400 | $153,400 | $177,000 |
| 2019 | $12,805 | $315,100 | $153,400 | $161,700 |
| 2018 | $9,981 | $315,100 | $153,400 | $161,700 |
| 2017 | $1,384 | $309,100 | $153,400 | $155,700 |
| 2016 | $94,607 | $303,000 | $153,400 | $149,600 |
| 2015 | $7,318 | $17,000 | $4,400 | $12,600 |
| 2014 | $7,318 | $17,000 | $4,400 | $12,600 |
| 2013 | $7,318 | $17,000 | $4,400 | $12,600 |
Source: Public Records
Map
Nearby Homes
- 48 Pershing Ave
- 41 Croton Dam Rd
- 7 Grandview Ave
- 16 Robin St
- 7 Hawkes Ave
- 42 Campwoods Grounds
- 19 Forest Ave
- 200 Route 9a
- 1C Calam Ave
- 33 Ryder Rd
- 113 Antler Ridge Unit 113
- 15 Ferris Place
- 132 Croton Ave
- 40 Minkel Rd
- 7 Bracken Rd
- 38 Terrace Ave
- 47 Stormytown Rd
- 13 Reeback Dr
- 19 Donald Ln
- 8 Hudson Watch Dr
Your Personal Tour Guide
Ask me questions while you tour the home.