Estimated Value: $572,365 - $810,000
3
Beds
1
Bath
900
Sq Ft
$763/Sq Ft
Est. Value
About This Home
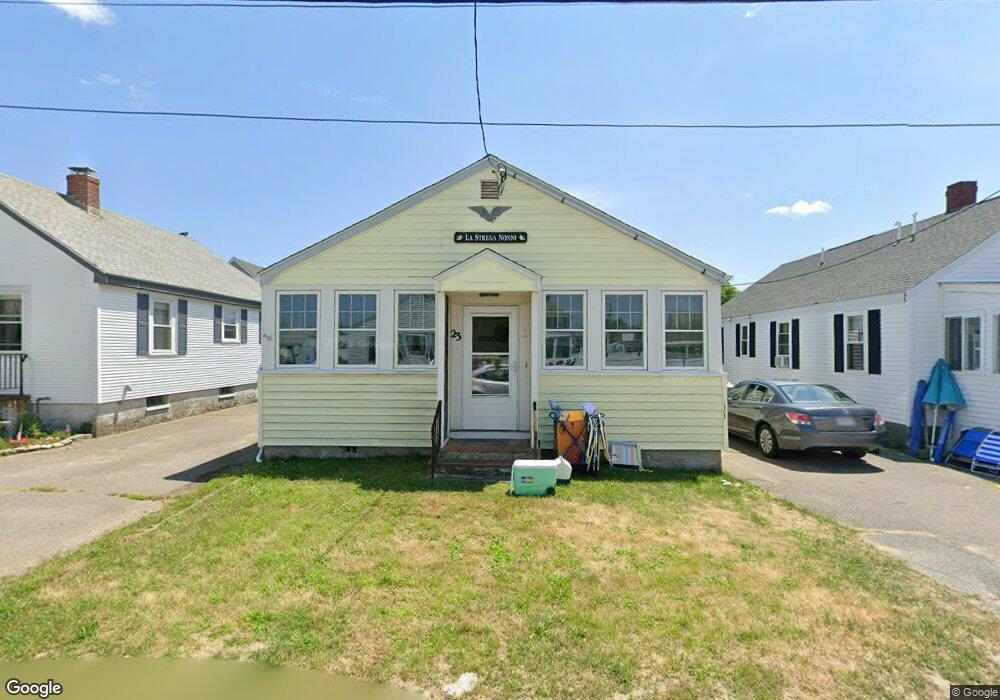
This home is located at 23 5th Rd, Marshfield, MA 02050 and is currently estimated at $687,091, approximately $763 per square foot. 23 5th Rd is a home located in Plymouth County with nearby schools including Daniel Webster, Furnace Brook Middle School, and Marshfield High School.
Ownership History
Date
Name
Owned For
Owner Type
Purchase Details
Closed on
May 28, 2025
Sold by
Santilli Philip A
Bought by
Santilli Philip A and Castater Brandon J
Current Estimated Value
Purchase Details
Closed on
May 2, 2011
Sold by
Towner Jo A
Bought by
Santilli Philip A and Towner Jo A
Purchase Details
Closed on
Apr 24, 2009
Sold by
Winn Kathleen
Bought by
Towner Joanne
Home Financials for this Owner
Home Financials are based on the most recent Mortgage that was taken out on this home.
Original Mortgage
$208,000
Interest Rate
4.93%
Mortgage Type
Purchase Money Mortgage
Purchase Details
Closed on
Jun 3, 1999
Sold by
Donovan Marguerite Est
Bought by
Winn Kathleen
Home Financials for this Owner
Home Financials are based on the most recent Mortgage that was taken out on this home.
Original Mortgage
$51,250
Interest Rate
6.85%
Mortgage Type
Purchase Money Mortgage
Create a Home Valuation Report for This Property
The Home Valuation Report is an in-depth analysis detailing your home's value as well as a comparison with similar homes in the area
Home Values in the Area
Average Home Value in this Area
Purchase History
| Date | Buyer | Sale Price | Title Company |
|---|---|---|---|
| Santilli Philip A | -- | None Available | |
| Santilli Philip A | -- | None Available | |
| Santilli Philip A | -- | -- | |
| Santilli Philip A | -- | -- | |
| Towner Joanne | $260,000 | -- | |
| Towner Joanne | $260,000 | -- | |
| Winn Kathleen | $155,000 | -- | |
| Winn Kathleen | $155,000 | -- |
Source: Public Records
Mortgage History
| Date | Status | Borrower | Loan Amount |
|---|---|---|---|
| Previous Owner | Winn Kathleen | $208,000 | |
| Previous Owner | Winn Kathleen | $51,250 |
Source: Public Records
Tax History
| Year | Tax Paid | Tax Assessment Tax Assessment Total Assessment is a certain percentage of the fair market value that is determined by local assessors to be the total taxable value of land and additions on the property. | Land | Improvement |
|---|---|---|---|---|
| 2025 | $5,636 | $569,300 | $453,600 | $115,700 |
| 2024 | $5,349 | $514,800 | $405,000 | $109,800 |
| 2023 | $5,420 | $459,400 | $367,200 | $92,200 |
| 2022 | $5,420 | $418,500 | $333,000 | $85,500 |
| 2021 | $5,413 | $410,400 | $333,000 | $77,400 |
| 2020 | $4,864 | $364,900 | $291,600 | $73,300 |
| 2019 | $4,828 | $360,800 | $291,600 | $69,200 |
| 2018 | $4,294 | $321,200 | $252,000 | $69,200 |
| 2017 | $4,292 | $312,800 | $252,000 | $60,800 |
| 2016 | $4,167 | $300,200 | $239,400 | $60,800 |
| 2015 | $3,990 | $300,200 | $239,400 | $60,800 |
| 2014 | $3,930 | $295,700 | $239,400 | $56,300 |
Source: Public Records
Map
Nearby Homes
Your Personal Tour Guide
Ask me questions while you tour the home.