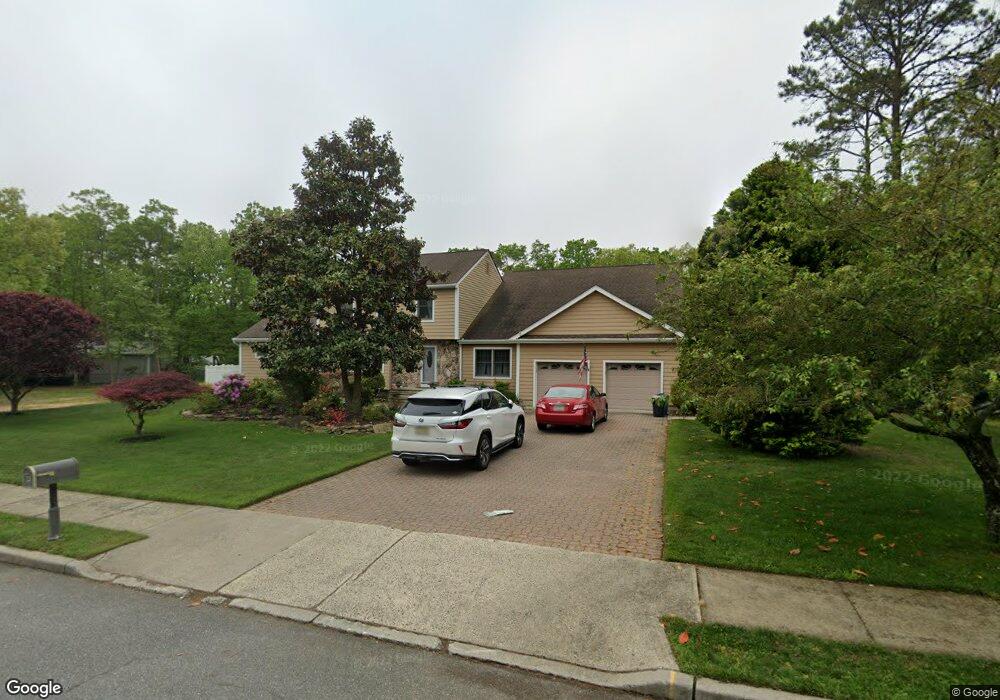
23 5th St Barnegat, NJ 08005
Barnegat Township NeighborhoodEstimated Value: $1,053,000 - $1,580,000
3
Beds
2
Baths
1,368
Sq Ft
$984/Sq Ft
Est. Value
About This Home
This home is located at 23 5th St, Barnegat, NJ 08005 and is currently estimated at $1,346,281, approximately $984 per square foot. 23 5th St is a home located in Ocean County with nearby schools including Barnegat High School.
Ownership History
Date
Name
Owned For
Owner Type
Purchase Details
Closed on
Apr 3, 2013
Sold by
Brady Dorothy and Zauli Franco
Bought by
Zauli Franco and Brady Dorothy
Current Estimated Value
Home Financials for this Owner
Home Financials are based on the most recent Mortgage that was taken out on this home.
Original Mortgage
$388,786
Outstanding Balance
$275,669
Interest Rate
3.57%
Mortgage Type
FHA
Estimated Equity
$1,070,612
Purchase Details
Closed on
Jul 27, 2003
Sold by
Brady Kevin J
Bought by
Brady Dorothy M
Create a Home Valuation Report for This Property
The Home Valuation Report is an in-depth analysis detailing your home's value as well as a comparison with similar homes in the area
Home Values in the Area
Average Home Value in this Area
Purchase History
| Date | Buyer | Sale Price | Title Company |
|---|---|---|---|
| Zauli Franco | -- | None Available | |
| Brady Dorothy M | -- | -- |
Source: Public Records
Mortgage History
| Date | Status | Borrower | Loan Amount |
|---|---|---|---|
| Open | Zauli Franco | $388,786 |
Source: Public Records
Tax History Compared to Growth
Tax History
| Year | Tax Paid | Tax Assessment Tax Assessment Total Assessment is a certain percentage of the fair market value that is determined by local assessors to be the total taxable value of land and additions on the property. | Land | Improvement |
|---|---|---|---|---|
| 2025 | $5,635 | $559,000 | $380,000 | $179,000 |
| 2024 | $4,981 | $559,000 | $380,000 | $179,000 |
| 2023 | $4,623 | $559,000 | $380,000 | $179,000 |
| 2022 | $4,623 | $559,000 | $380,000 | $179,000 |
| 2021 | $4,975 | $559,000 | $380,000 | $179,000 |
| 2020 | $5,048 | $559,000 | $380,000 | $179,000 |
| 2019 | $4,863 | $559,000 | $380,000 | $179,000 |
| 2018 | $4,779 | $559,000 | $380,000 | $179,000 |
| 2017 | $4,947 | $559,000 | $380,000 | $179,000 |
| 2016 | $4,819 | $559,000 | $380,000 | $179,000 |
| 2015 | $4,645 | $559,000 | $380,000 | $179,000 |
| 2014 | $5,054 | $559,100 | $380,000 | $179,100 |
Source: Public Records
Map
Nearby Homes
- 28 Pond View Cir
- 18 Valley Stream Place
- 24 Pond View Cir
- 91 Highland Dr
- 78 Mirage Blvd
- 98 Mirage Blvd
- 14 Ridge Rd
- 3 Lakeland Dr
- 9 Spring Lake Ct
- 32 1st St
- 7 River Bend Ct
- 6 Swan Lake Ct
- 23 Silver Lake Dr
- 150 Mirage Blvd
- 15 Shady Stream Rd
- 7 Old Mill Ct
- 224 Mirage Blvd
- 179 Mirage Blvd
- 66 Butler Dr
- 19 Windy Reef Ct
- 23 5th St
- 27 5th St
- 67 Highland Dr
- 69 Highland Dr
- 65 Highland Dr
- 50 5th St Unit 15
- 50 5th St Unit 14
- 50 5th St Unit 13
- 50 5th St Unit 12
- 50 5th St Unit 11
- 50 5th St Unit 10
- 71 Highland Dr
- 26 5th St
- 63 Highland Dr
- 29 5th St
- 24 5th St
- 25 5th St Unit R-1
- 25 5th St Unit C-2
- 25 5th St Unit 1
- 73 Highland Dr