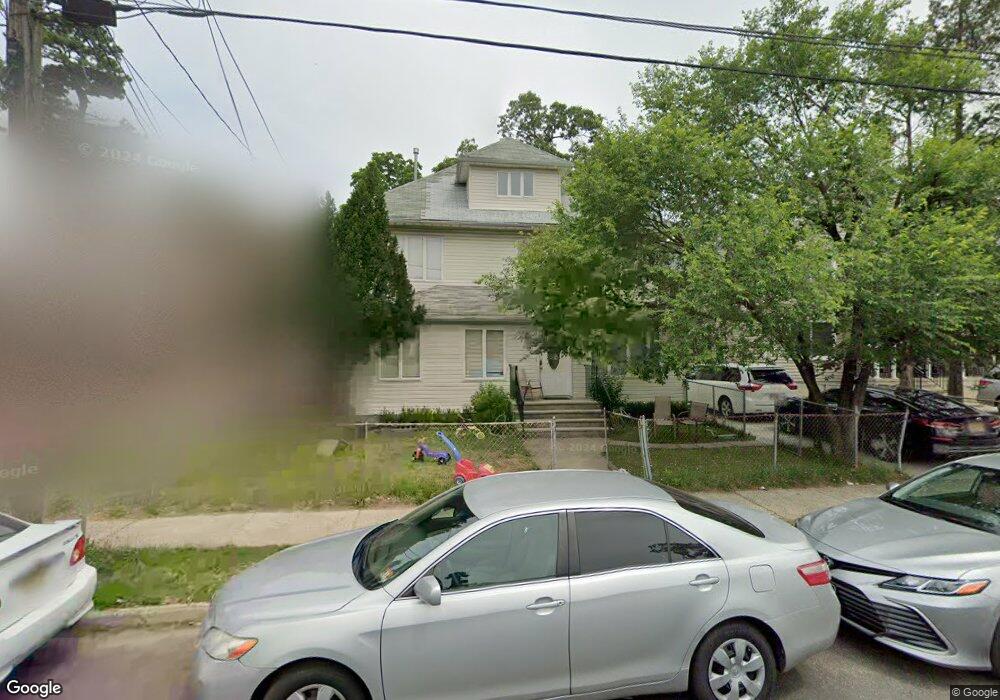
23 7th St Lakewood, NJ 08701
Estimated Value: $894,910 - $1,268,000
--
Bed
4
Baths
2,276
Sq Ft
$472/Sq Ft
Est. Value
About This Home
This home is located at 23 7th St, Lakewood, NJ 08701 and is currently estimated at $1,074,228, approximately $471 per square foot. 23 7th St is a home located in Ocean County with nearby schools including Lakewood High School, Yeshiva Masoras Avos, and Yeshiva K'tana Of Lakewood.
Ownership History
Date
Name
Owned For
Owner Type
Purchase Details
Closed on
Mar 11, 2010
Sold by
Massry Abraham
Bought by
Cohen Ronald
Current Estimated Value
Home Financials for this Owner
Home Financials are based on the most recent Mortgage that was taken out on this home.
Original Mortgage
$198,750
Interest Rate
4.43%
Mortgage Type
New Conventional
Purchase Details
Closed on
Nov 10, 2005
Sold by
Mincey Claude
Bought by
Massry Abraham
Create a Home Valuation Report for This Property
The Home Valuation Report is an in-depth analysis detailing your home's value as well as a comparison with similar homes in the area
Home Values in the Area
Average Home Value in this Area
Purchase History
| Date | Buyer | Sale Price | Title Company |
|---|---|---|---|
| Cohen Ronald | $265,000 | Old Republic National Title | |
| Massry Abraham | $345,000 | Madison Title Agency Llc |
Source: Public Records
Mortgage History
| Date | Status | Borrower | Loan Amount |
|---|---|---|---|
| Closed | Cohen Ronald | $198,750 |
Source: Public Records
Tax History Compared to Growth
Tax History
| Year | Tax Paid | Tax Assessment Tax Assessment Total Assessment is a certain percentage of the fair market value that is determined by local assessors to be the total taxable value of land and additions on the property. | Land | Improvement |
|---|---|---|---|---|
| 2025 | $11,016 | $443,300 | $210,200 | $233,100 |
| 2024 | $10,480 | $443,300 | $210,200 | $233,100 |
| 2023 | $10,116 | $443,300 | $210,200 | $233,100 |
| 2022 | $10,116 | $443,300 | $210,200 | $233,100 |
| 2021 | $10,098 | $443,300 | $210,200 | $233,100 |
| 2020 | $10,072 | $443,300 | $210,200 | $233,100 |
| 2019 | $9,691 | $443,300 | $210,200 | $233,100 |
| 2018 | $9,300 | $443,300 | $210,200 | $233,100 |
| 2017 | $9,097 | $443,300 | $210,200 | $233,100 |
| 2016 | $10,237 | $349,400 | $177,500 | $171,900 |
| 2015 | $9,905 | $349,400 | $177,500 | $171,900 |
| 2014 | $9,395 | $349,400 | $177,500 | $171,900 |
Source: Public Records
Map
Nearby Homes