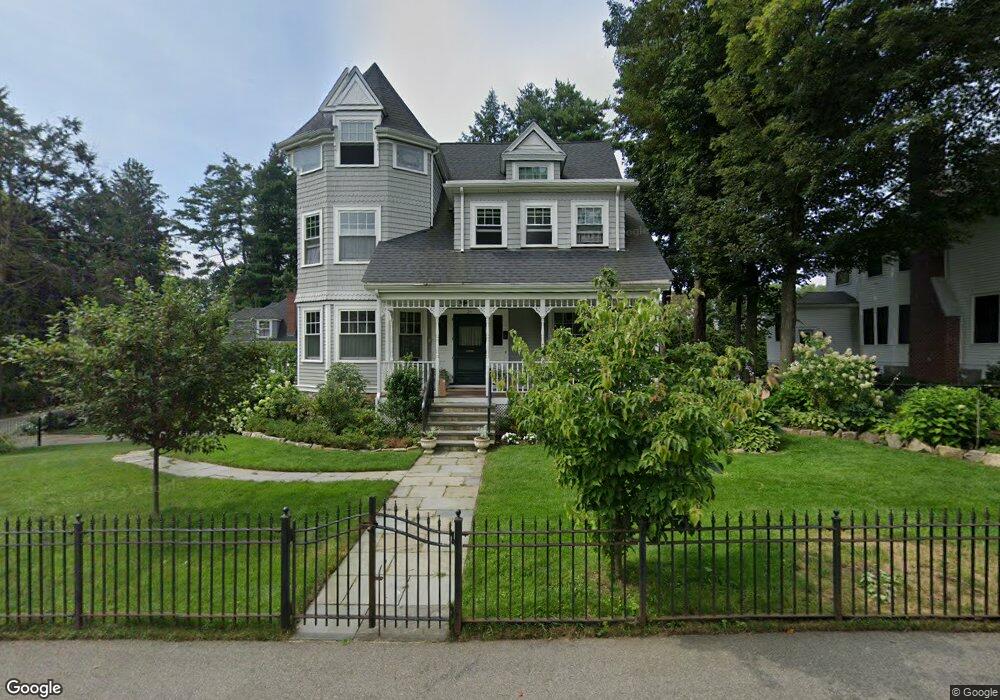
23 Abbott Rd Wellesley Hills, MA 02481
Wellesley Hills NeighborhoodEstimated Value: $2,065,000 - $2,443,000
5
Beds
4
Baths
3,310
Sq Ft
$669/Sq Ft
Est. Value
About This Home
This home is located at 23 Abbott Rd, Wellesley Hills, MA 02481 and is currently estimated at $2,215,493, approximately $669 per square foot. 23 Abbott Rd is a home located in Norfolk County with nearby schools including Joseph E. Fiske Elementary School, Wellesley Middle School, and Wellesley Sr High School.
Ownership History
Date
Name
Owned For
Owner Type
Purchase Details
Closed on
Aug 24, 2006
Sold by
Calhoun Barbara H and Calhoun Paul W
Bought by
Maggiacomo Maryellen C and Maggiacomo Stephen
Current Estimated Value
Purchase Details
Closed on
Dec 2, 1993
Sold by
Heywood John C and Heywood Maria H
Bought by
Calhoun Paul W and Calhoun Barbara H
Purchase Details
Closed on
Oct 24, 1989
Sold by
Bryant Edward C
Bought by
Heywood John C
Create a Home Valuation Report for This Property
The Home Valuation Report is an in-depth analysis detailing your home's value as well as a comparison with similar homes in the area
Home Values in the Area
Average Home Value in this Area
Purchase History
| Date | Buyer | Sale Price | Title Company |
|---|---|---|---|
| Maggiacomo Maryellen C | $1,017,700 | -- | |
| Calhoun Paul W | $510,000 | -- | |
| Heywood John C | $344,000 | -- |
Source: Public Records
Mortgage History
| Date | Status | Borrower | Loan Amount |
|---|---|---|---|
| Open | Heywood John C | $417,000 | |
| Closed | Heywood John C | $200,000 |
Source: Public Records
Tax History
| Year | Tax Paid | Tax Assessment Tax Assessment Total Assessment is a certain percentage of the fair market value that is determined by local assessors to be the total taxable value of land and additions on the property. | Land | Improvement |
|---|---|---|---|---|
| 2025 | $16,479 | $1,603,000 | $981,000 | $622,000 |
| 2024 | $16,031 | $1,540,000 | $939,000 | $601,000 |
| 2023 | $15,606 | $1,363,000 | $819,000 | $544,000 |
| 2022 | $14,355 | $1,229,000 | $677,000 | $552,000 |
| 2021 | $14,441 | $1,229,000 | $677,000 | $552,000 |
| 2020 | $14,207 | $1,229,000 | $677,000 | $552,000 |
| 2019 | $13,722 | $1,186,000 | $649,000 | $537,000 |
| 2018 | $13,958 | $1,168,000 | $643,000 | $525,000 |
| 2017 | $12,780 | $1,084,000 | $643,000 | $441,000 |
| 2016 | $12,540 | $1,060,000 | $633,000 | $427,000 |
| 2015 | $11,941 | $1,033,000 | $605,000 | $428,000 |
Source: Public Records
Map
Nearby Homes
- 19 Abbott Rd
- 3 Caroline St
- 26 Abbott Rd
- 16 Abbott Rd
- 15 Abbott Rd
- 5 Caroline St
- 31 Abbott Rd
- 31 Abbott Rd Unit Carriage House
- 30 Abbott Rd
- 10 Prescott St
- 7 Bemis Rd
- 5 Bemis Rd
- 11 Abbott Rd
- 11 Abbott Rd Unit 11
- 11 Abbott Rd
- 28 Abbott Rd
- 14 Caroline St
- 7000 Bemis Rd
- 11 Bemis Rd Unit 4
- 11 Bemis Rd Unit 3
Your Personal Tour Guide
Ask me questions while you tour the home.