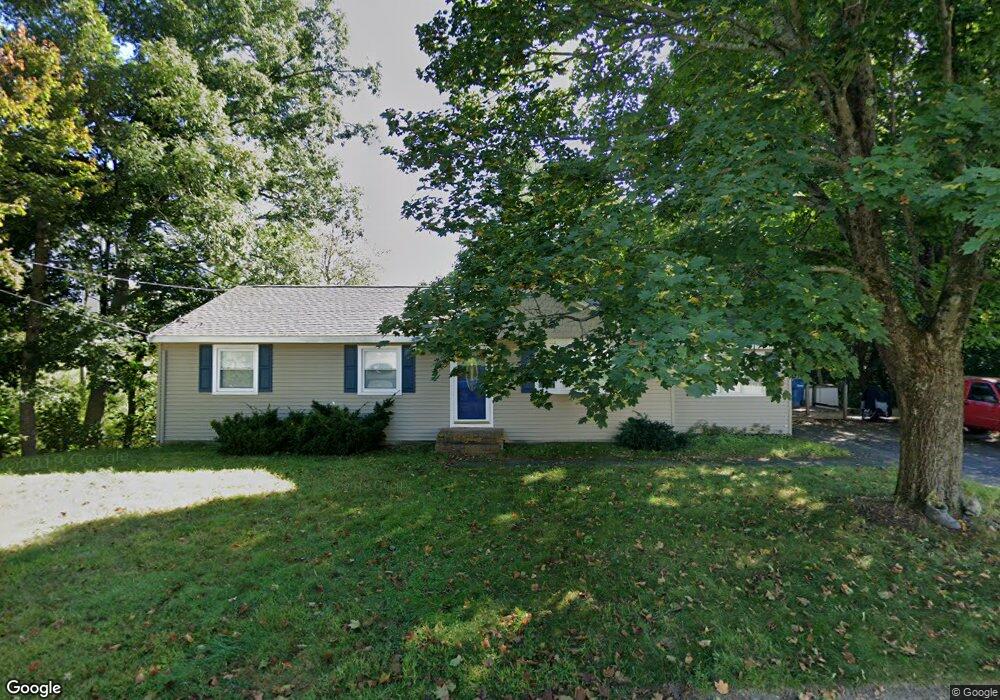
23 Amos St Tewksbury, MA 01876
Estimated Value: $583,000 - $685,000
3
Beds
2
Baths
1,434
Sq Ft
$451/Sq Ft
Est. Value
About This Home
This home is located at 23 Amos St, Tewksbury, MA 01876 and is currently estimated at $646,509, approximately $450 per square foot. 23 Amos St is a home located in Middlesex County with nearby schools including Heath-Brook Elementary School, John W. Wynn Middle School, and John F. Ryan Elementary School.
Ownership History
Date
Name
Owned For
Owner Type
Purchase Details
Closed on
Jul 8, 1994
Sold by
Money Store Of Mass
Bought by
Demaio Vincent and Demaio Donna
Current Estimated Value
Purchase Details
Closed on
Jan 20, 1994
Sold by
Valente Elizabeth
Bought by
Money Store Mass Inc
Create a Home Valuation Report for This Property
The Home Valuation Report is an in-depth analysis detailing your home's value as well as a comparison with similar homes in the area
Home Values in the Area
Average Home Value in this Area
Purchase History
| Date | Buyer | Sale Price | Title Company |
|---|---|---|---|
| Demaio Vincent | $134,000 | -- | |
| Money Store Mass Inc | $15,000 | -- |
Source: Public Records
Mortgage History
| Date | Status | Borrower | Loan Amount |
|---|---|---|---|
| Open | Money Store Mass Inc | $194,000 | |
| Closed | Money Store Mass Inc | $165,000 |
Source: Public Records
Tax History Compared to Growth
Tax History
| Year | Tax Paid | Tax Assessment Tax Assessment Total Assessment is a certain percentage of the fair market value that is determined by local assessors to be the total taxable value of land and additions on the property. | Land | Improvement |
|---|---|---|---|---|
| 2025 | $7,190 | $543,900 | $273,800 | $270,100 |
| 2024 | $6,941 | $518,400 | $260,800 | $257,600 |
| 2023 | $6,843 | $485,300 | $237,200 | $248,100 |
| 2022 | $6,614 | $435,100 | $206,200 | $228,900 |
| 2021 | $7,727 | $400,800 | $187,500 | $213,300 |
| 2020 | $3,570 | $379,600 | $178,500 | $201,100 |
| 2019 | $5,649 | $356,600 | $170,000 | $186,600 |
| 2018 | $5,378 | $333,400 | $170,000 | $163,400 |
| 2017 | $5,115 | $313,600 | $170,000 | $143,600 |
| 2016 | $4,920 | $300,900 | $170,000 | $130,900 |
| 2015 | $4,631 | $282,900 | $164,900 | $118,000 |
| 2014 | $4,255 | $264,100 | $164,900 | $99,200 |
Source: Public Records
Map
Nearby Homes