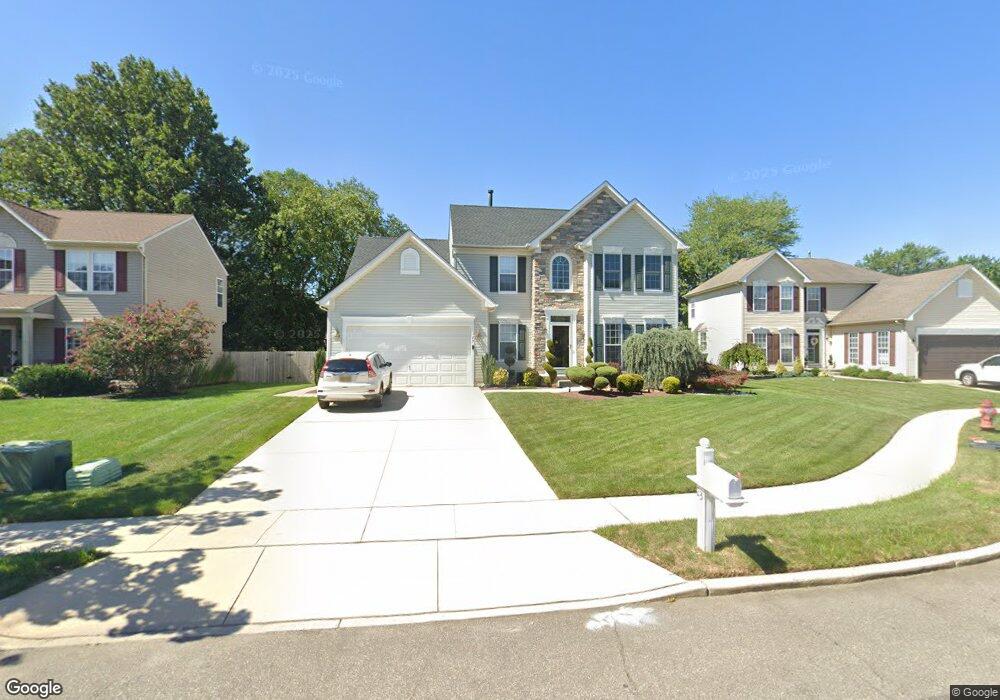
23 Ardmore Dr Bordentown, NJ 08505
Estimated Value: $572,376 - $704,000
--
Bed
--
Bath
2,648
Sq Ft
$240/Sq Ft
Est. Value
About This Home
This home is located at 23 Ardmore Dr, Bordentown, NJ 08505 and is currently estimated at $635,844, approximately $240 per square foot. 23 Ardmore Dr is a home located in Burlington County with nearby schools including Bordentown Reg High School and Meadow View Junior Academy.
Ownership History
Date
Name
Owned For
Owner Type
Purchase Details
Closed on
Aug 17, 2019
Sold by
Hrynizak Michael
Bought by
Hryniszak Elaine
Current Estimated Value
Home Financials for this Owner
Home Financials are based on the most recent Mortgage that was taken out on this home.
Original Mortgage
$217,000
Outstanding Balance
$190,052
Interest Rate
3.7%
Mortgage Type
New Conventional
Estimated Equity
$445,792
Purchase Details
Closed on
Sep 21, 2000
Home Financials for this Owner
Home Financials are based on the most recent Mortgage that was taken out on this home.
Original Mortgage
$187,500
Interest Rate
7.81%
Purchase Details
Closed on
Sep 1, 2000
Sold by
Nvr Inc
Bought by
Hryniszak Michael and Hryniszak Elaine
Home Financials for this Owner
Home Financials are based on the most recent Mortgage that was taken out on this home.
Original Mortgage
$187,500
Interest Rate
7.81%
Create a Home Valuation Report for This Property
The Home Valuation Report is an in-depth analysis detailing your home's value as well as a comparison with similar homes in the area
Home Values in the Area
Average Home Value in this Area
Purchase History
| Date | Buyer | Sale Price | Title Company |
|---|---|---|---|
| Hryniszak Elaine | -- | American Home Title Agency | |
| -- | $234,700 | -- | |
| Hryniszak Michael | $234,665 | First American Title Ins Co |
Source: Public Records
Mortgage History
| Date | Status | Borrower | Loan Amount |
|---|---|---|---|
| Open | Hryniszak Elaine | $217,000 | |
| Previous Owner | Hryniszak Michael | $187,500 |
Source: Public Records
Tax History Compared to Growth
Tax History
| Year | Tax Paid | Tax Assessment Tax Assessment Total Assessment is a certain percentage of the fair market value that is determined by local assessors to be the total taxable value of land and additions on the property. | Land | Improvement |
|---|---|---|---|---|
| 2025 | $12,394 | $335,600 | $100,000 | $235,600 |
| 2024 | $11,306 | $335,600 | $100,000 | $235,600 |
| 2023 | $11,306 | $335,600 | $100,000 | $235,600 |
| 2022 | $11,414 | $335,600 | $100,000 | $235,600 |
| 2021 | $11,978 | $335,600 | $100,000 | $235,600 |
| 2020 | $11,961 | $335,600 | $100,000 | $235,600 |
| 2019 | $11,743 | $335,600 | $100,000 | $235,600 |
| 2018 | $11,592 | $335,600 | $100,000 | $235,600 |
| 2017 | $11,233 | $335,600 | $100,000 | $235,600 |
| 2016 | $10,977 | $335,600 | $100,000 | $235,600 |
| 2015 | $10,743 | $335,600 | $100,000 | $235,600 |
| 2014 | $10,259 | $335,600 | $100,000 | $235,600 |
Source: Public Records
Map
Nearby Homes
- 6 Sweetbriar Ln
- 7 Red Barn Ln
- 310 Hopkinson St
- 70 E Park St Unit 1-10
- 12 E Burlington St
- 136 2nd St
- 21 E Church St
- 365 Prince St
- 402 Prince St
- 29 Courtland St
- 101 Walnut St
- 6 Delaware Dr
- 418 Willow St
- 31 Gloucester Ct Unit 22295
- 39 Gloucester Ct
- 26 Exeter Ct Unit 22160
- 14 Tioga Ct Unit 22353
- 3 Exeter Ct Unit 22137
- 26 Kennebec Ct Unit 22
- 50 Route 130