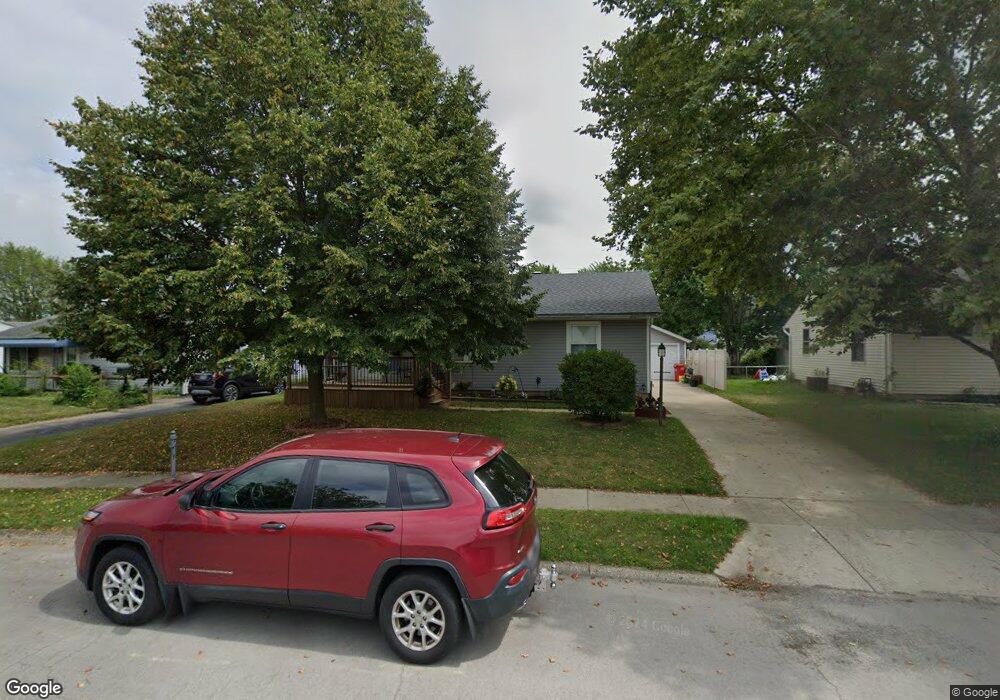
23 Arlington Ave London, OH 43140
Estimated Value: $213,000 - $241,000
3
Beds
1
Bath
1,168
Sq Ft
$195/Sq Ft
Est. Value
About This Home
This home is located at 23 Arlington Ave, London, OH 43140 and is currently estimated at $228,205, approximately $195 per square foot. 23 Arlington Ave is a home located in Madison County with nearby schools including London Elementary School, London Middle School, and London High School.
Ownership History
Date
Name
Owned For
Owner Type
Purchase Details
Closed on
Nov 30, 2007
Sold by
Seaburn Ryan L and Seaburn Amanda K
Bought by
Lindsey Francis W and Lindsey Leah D
Current Estimated Value
Home Financials for this Owner
Home Financials are based on the most recent Mortgage that was taken out on this home.
Original Mortgage
$119,900
Outstanding Balance
$76,009
Interest Rate
6.33%
Mortgage Type
Purchase Money Mortgage
Estimated Equity
$152,196
Purchase Details
Closed on
Feb 24, 2006
Sold by
Sifrit Adam Douglas and Sifrit Kelly
Bought by
Seaburn Ryan L and Mullins Amanda K
Home Financials for this Owner
Home Financials are based on the most recent Mortgage that was taken out on this home.
Original Mortgage
$92,862
Interest Rate
6.2%
Mortgage Type
FHA
Purchase Details
Closed on
Feb 17, 2004
Sold by
Thaler Marjorie L and Mcclaskie Marjorie L
Bought by
Sifrit Adam Douglas
Home Financials for this Owner
Home Financials are based on the most recent Mortgage that was taken out on this home.
Original Mortgage
$46,723
Interest Rate
5.96%
Mortgage Type
Unknown
Create a Home Valuation Report for This Property
The Home Valuation Report is an in-depth analysis detailing your home's value as well as a comparison with similar homes in the area
Home Values in the Area
Average Home Value in this Area
Purchase History
| Date | Buyer | Sale Price | Title Company |
|---|---|---|---|
| Lindsey Francis W | $119,900 | Chicago Title | |
| Seaburn Ryan L | $95,000 | Midland Title | |
| Sifrit Adam Douglas | $90,000 | Midland Title |
Source: Public Records
Mortgage History
| Date | Status | Borrower | Loan Amount |
|---|---|---|---|
| Open | Lindsey Francis W | $119,900 | |
| Closed | Seaburn Ryan L | $92,862 | |
| Closed | Sifrit Adam Douglas | $46,723 |
Source: Public Records
Tax History Compared to Growth
Tax History
| Year | Tax Paid | Tax Assessment Tax Assessment Total Assessment is a certain percentage of the fair market value that is determined by local assessors to be the total taxable value of land and additions on the property. | Land | Improvement |
|---|---|---|---|---|
| 2024 | $1,924 | $62,890 | $13,710 | $49,180 |
| 2023 | $1,924 | $62,890 | $13,710 | $49,180 |
| 2022 | $1,555 | $46,510 | $10,000 | $36,510 |
| 2021 | $1,549 | $46,510 | $10,000 | $36,510 |
| 2020 | $1,549 | $46,510 | $10,000 | $36,510 |
| 2019 | $1,345 | $39,950 | $8,820 | $31,130 |
| 2018 | $1,463 | $39,950 | $8,820 | $31,130 |
| 2017 | $1,438 | $39,950 | $8,820 | $31,130 |
| 2016 | $1,216 | $34,360 | $8,820 | $25,540 |
| 2015 | $1,394 | $34,360 | $8,820 | $25,540 |
| 2014 | $1,394 | $34,360 | $8,820 | $25,540 |
| 2013 | -- | $39,390 | $8,230 | $31,160 |
Source: Public Records
Map
Nearby Homes
- 25 Arlington Ave
- 21 Arlington Ave
- 12 Westmoor Dr
- 27 Arlington Ave
- 24 Arlington Ave
- 29 Arlington Ave
- 6 Westmoor Dr
- 28 Arlington Ave
- 26 Westmoor Dr
- 4 Westmoor Dr
- 13 Westmoor Dr
- 11 Westmoor Dr
- 31 Arlington Ave
- 9 Westmoor Dr
- 15 Westmoor Dr
- 17 Westmoor Dr
- 32 Arlington Ave
- 191 W High St
- 195 W High St
- 193 W High St