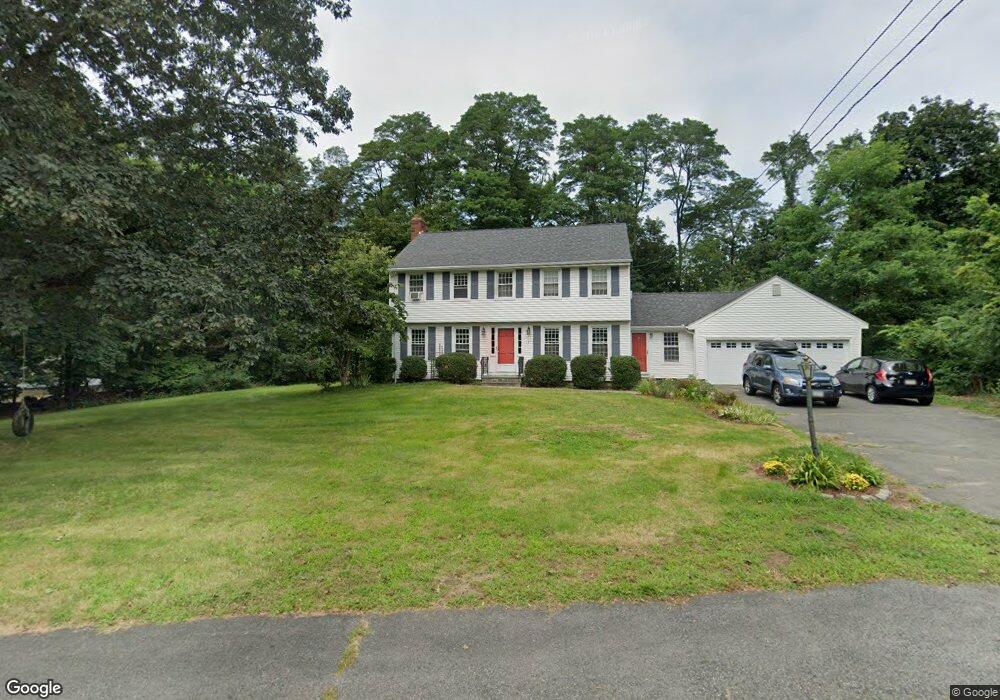
23 Bedford St Burlington, MA 01803
Burlington Town Center NeighborhoodEstimated Value: $672,000 - $796,000
2
Beds
2
Baths
1,643
Sq Ft
$435/Sq Ft
Est. Value
About This Home
This home is located at 23 Bedford St, Burlington, MA 01803 and is currently estimated at $714,016, approximately $434 per square foot. 23 Bedford St is a home located in Middlesex County with nearby schools including Burlington High School, Marshall Simonds Middle School, and Mount Hope Christian School.
Ownership History
Date
Name
Owned For
Owner Type
Purchase Details
Closed on
Feb 12, 2025
Sold by
36 Winn Street Rt and Santoro
Bought by
A J
Current Estimated Value
Purchase Details
Closed on
Aug 18, 2015
Sold by
Duckman Maryellen
Bought by
36 Winn Street Rt and Esposito
Purchase Details
Closed on
Feb 14, 2008
Sold by
Duckman Len J and Duckman Maryellen
Bought by
Duckman Maryellen
Home Financials for this Owner
Home Financials are based on the most recent Mortgage that was taken out on this home.
Original Mortgage
$338,000
Interest Rate
6.14%
Mortgage Type
Purchase Money Mortgage
Purchase Details
Closed on
May 6, 2005
Sold by
Stetson Jennifer L and Milne Jennifer
Bought by
Duckman Len J and Duckman Maryellen
Home Financials for this Owner
Home Financials are based on the most recent Mortgage that was taken out on this home.
Original Mortgage
$302,400
Interest Rate
6.01%
Mortgage Type
Purchase Money Mortgage
Purchase Details
Closed on
Dec 31, 2002
Sold by
Mccarthy Gloria
Bought by
Milne Sean M and Stetson Jennifer L
Purchase Details
Closed on
Nov 23, 1987
Sold by
Perry George L
Bought by
Perry Glenn E
Create a Home Valuation Report for This Property
The Home Valuation Report is an in-depth analysis detailing your home's value as well as a comparison with similar homes in the area
Home Values in the Area
Average Home Value in this Area
Purchase History
| Date | Buyer | Sale Price | Title Company |
|---|---|---|---|
| A J | -- | None Available | |
| A J | -- | None Available | |
| 36 Winn Street Rt | $375,000 | -- | |
| 36 Winn Street Rt | $375,000 | -- | |
| Duckman Maryellen | -- | -- | |
| Duckman Maryellen | -- | -- | |
| Duckman Maryellen | -- | -- | |
| Duckman Len J | $378,000 | -- | |
| Duckman Len J | $378,000 | -- | |
| Milne Sean M | $290,000 | -- | |
| Milne Sean M | $290,000 | -- | |
| Perry Glenn E | $70,000 | -- |
Source: Public Records
Mortgage History
| Date | Status | Borrower | Loan Amount |
|---|---|---|---|
| Previous Owner | Duckman Maryellen | $338,000 | |
| Previous Owner | Duckman Len J | $302,400 |
Source: Public Records
Tax History Compared to Growth
Tax History
| Year | Tax Paid | Tax Assessment Tax Assessment Total Assessment is a certain percentage of the fair market value that is determined by local assessors to be the total taxable value of land and additions on the property. | Land | Improvement |
|---|---|---|---|---|
| 2025 | $4,682 | $540,600 | $334,000 | $206,600 |
| 2024 | $4,447 | $497,400 | $308,100 | $189,300 |
| 2023 | $4,246 | $451,700 | $267,200 | $184,500 |
| 2022 | $4,356 | $437,800 | $246,800 | $191,000 |
| 2021 | $7,470 | $415,000 | $224,000 | $191,000 |
| 2020 | $484 | $411,100 | $220,100 | $191,000 |
| 2019 | $3,632 | $346,600 | $200,400 | $146,200 |
| 2018 | $3,527 | $332,100 | $191,000 | $141,100 |
| 2017 | $3,478 | $332,100 | $191,000 | $141,100 |
| 2016 | $3,455 | $301,500 | $165,000 | $136,500 |
| 2015 | $3,422 | $301,500 | $165,000 | $136,500 |
| 2014 | $3,469 | $289,100 | $157,200 | $131,900 |
Source: Public Records
Map
Nearby Homes
- 129 Cambridge St Unit 1
- 5 Shady Lane Dr
- 210 Winn St
- 27 Purity Springs Rd
- 6 Arthur Woods Ave
- 10 Murray Ave Unit 15
- 12 Murray Ave Unit 18
- 29 Grove Ln Unit 29
- 50 Hill Cir
- 51 Terrace Hall Ave
- 38 Freeport Dr
- 20 Lantern Ln
- 9 Woodside Ln
- 1 Hallmark Gardens Unit 8
- 5 Hallmark Gardens Unit 7
- 12 Pleasant St
- 1 Violet Rd
- 42 Lantern Ln
- 11 Violet Rd
- 3 County Rd
- 21 Bedford St
- 21 Bedford St Unit 21
- 25 Bedford St Unit A
- 25 Bedford St
- 19 Bedford St
- 27 Bedford St
- 12 Lexington St
- 26 Bedford St
- 24 Bedford St
- 28 Bedford St
- 29 Bedford St
- 30 Bedford St
- 22 Bedford St
- 5 Nichold St
- 10 Ainsworth St
- 29 Church Ln
- 3 Nichold St
- 2 Hidden Valley Dr
- 9 Lexington St
- 7 Lexington St