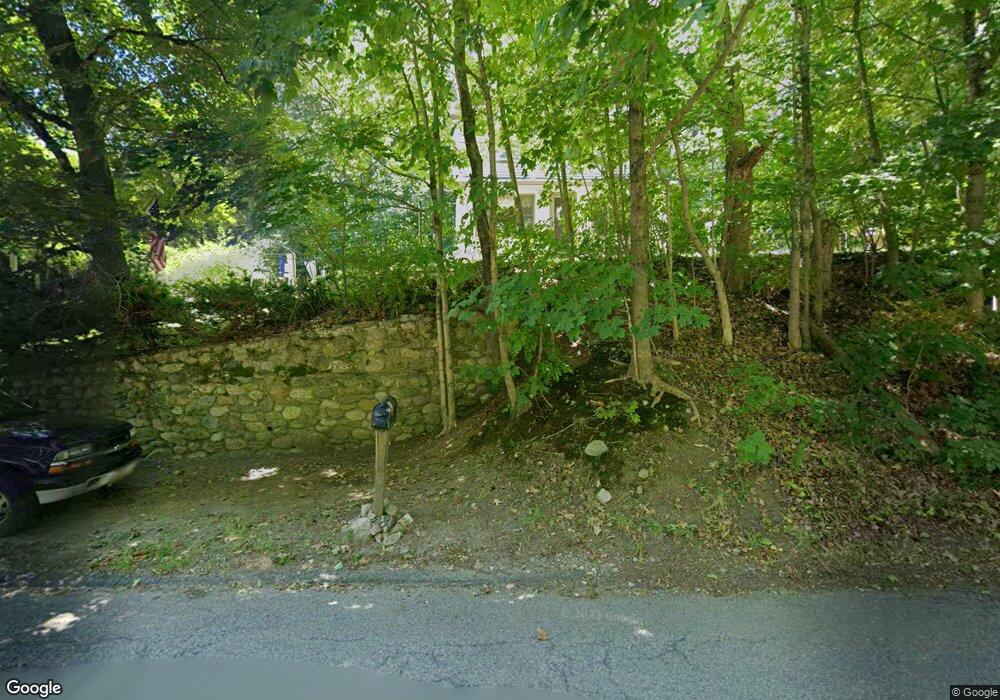
23 Bennett St Wrentham, MA 02093
Estimated Value: $492,000 - $606,000
3
Beds
1
Bath
1,380
Sq Ft
$384/Sq Ft
Est. Value
About This Home
This home is located at 23 Bennett St, Wrentham, MA 02093 and is currently estimated at $529,400, approximately $383 per square foot. 23 Bennett St is a home located in Norfolk County with nearby schools including Delaney Elementary School and Charles E Roderick.
Ownership History
Date
Name
Owned For
Owner Type
Purchase Details
Closed on
Dec 14, 2021
Sold by
Bombardieri Thomas D and Bombardieri Deborah
Bought by
Bombardieri Family Irt
Current Estimated Value
Purchase Details
Closed on
Apr 26, 1979
Bought by
Bombardieri Thomas D and Bombardieri Debrah
Create a Home Valuation Report for This Property
The Home Valuation Report is an in-depth analysis detailing your home's value as well as a comparison with similar homes in the area
Purchase History
| Date | Buyer | Sale Price | Title Company |
|---|---|---|---|
| Bombardieri Family Irt | -- | None Available | |
| Bombardieri Thomas D | -- | -- |
Source: Public Records
Mortgage History
| Date | Status | Borrower | Loan Amount |
|---|---|---|---|
| Previous Owner | Bombardieri Thomas D | $36,500 | |
| Previous Owner | Bombardieri Thomas D | $37,500 | |
| Previous Owner | Bombardieri Thomas D | $60,000 |
Source: Public Records
Tax History
| Year | Tax Paid | Tax Assessment Tax Assessment Total Assessment is a certain percentage of the fair market value that is determined by local assessors to be the total taxable value of land and additions on the property. | Land | Improvement |
|---|---|---|---|---|
| 2025 | $5,510 | $475,400 | $279,200 | $196,200 |
| 2024 | $5,364 | $447,000 | $279,200 | $167,800 |
| 2023 | $5,075 | $402,100 | $253,800 | $148,300 |
| 2022 | $4,905 | $358,800 | $236,700 | $122,100 |
| 2021 | $4,538 | $322,500 | $206,600 | $115,900 |
| 2020 | $4,339 | $304,500 | $183,700 | $120,800 |
| 2019 | $4,212 | $298,300 | $183,700 | $114,600 |
| 2018 | $4,268 | $299,700 | $183,900 | $115,800 |
| 2017 | $4,067 | $285,400 | $180,300 | $105,100 |
| 2016 | $3,973 | $278,200 | $175,100 | $103,100 |
| 2015 | $3,899 | $260,300 | $168,400 | $91,900 |
| 2014 | $3,834 | $250,400 | $161,900 | $88,500 |
Source: Public Records
Map
Nearby Homes
- 10 Earle Stewart Ln Unit Lot 5
- 12 Earle Stewart Ln
- 2 Earle Stewart Ln
- 3 Earle Stewart Ln
- 135 Creek St Unit 2
- 613 West St
- 440 Chestnut St
- 1222 South St
- 23 Horseshoe Dr
- 440 South St
- 10 Nature View Dr
- 15 Nature View Dr
- 500 Franklin St
- 0 Berry St
- 18 Huntington Ave
- 19 Chestnut St Lot 2
- 19 Chestnut St Lot 3
- 20 Field Cir
- 1 Chestnut St
- 11 Amber Dr
Your Personal Tour Guide
Ask me questions while you tour the home.