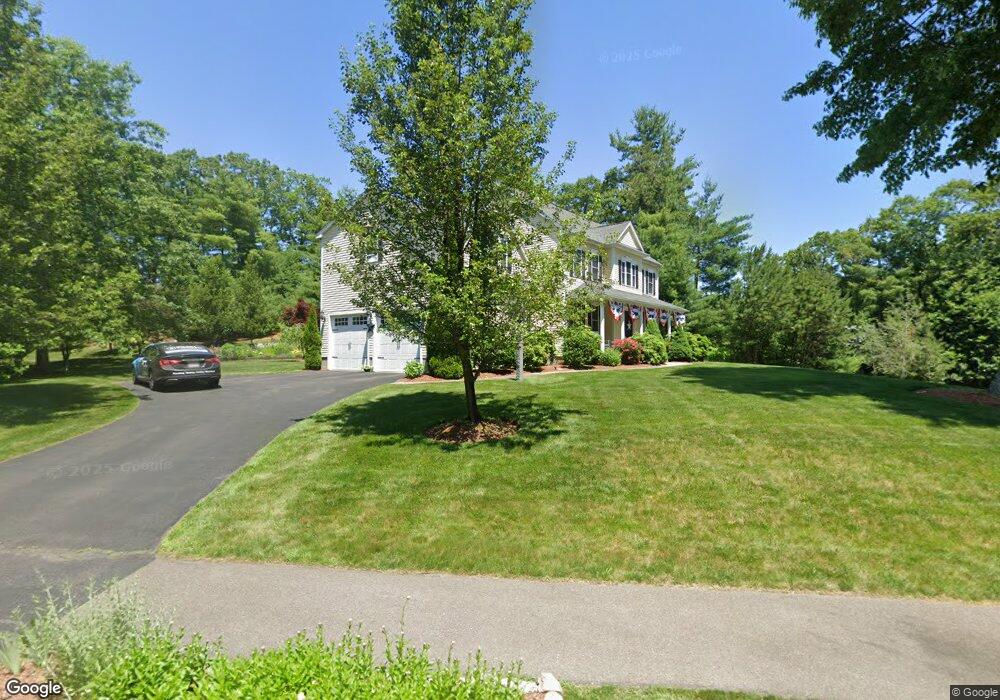
23 Berkeley Dr Walpole, MA 02081
Estimated Value: $1,334,000 - $1,522,000
4
Beds
3
Baths
2,588
Sq Ft
$544/Sq Ft
Est. Value
About This Home
This home is located at 23 Berkeley Dr, Walpole, MA 02081 and is currently estimated at $1,407,949, approximately $544 per square foot. 23 Berkeley Dr is a home with nearby schools including Fisher School, Walpole Middle School, and Walpole High School.
Ownership History
Date
Name
Owned For
Owner Type
Purchase Details
Closed on
Dec 9, 2024
Sold by
Vaishnav Kandarp H and Vaishnav Nancy M
Bought by
Johnston Vaishnav Ft and Vaishnav
Current Estimated Value
Purchase Details
Closed on
May 14, 2010
Sold by
Jese Constr Inc
Bought by
Vaishnav Nancy M and Vaishnav Kandarp H
Home Financials for this Owner
Home Financials are based on the most recent Mortgage that was taken out on this home.
Original Mortgage
$150,000
Interest Rate
5.11%
Mortgage Type
Purchase Money Mortgage
Purchase Details
Closed on
Mar 15, 2006
Sold by
Brush Hill Rt and Hasenjaeger John
Bought by
Mbt Rt and Tomasello William T
Home Financials for this Owner
Home Financials are based on the most recent Mortgage that was taken out on this home.
Original Mortgage
$400,000
Interest Rate
6.27%
Mortgage Type
Purchase Money Mortgage
Create a Home Valuation Report for This Property
The Home Valuation Report is an in-depth analysis detailing your home's value as well as a comparison with similar homes in the area
Home Values in the Area
Average Home Value in this Area
Purchase History
| Date | Buyer | Sale Price | Title Company |
|---|---|---|---|
| Johnston Vaishnav Ft | -- | None Available | |
| Johnston Vaishnav Ft | -- | None Available | |
| Vaishnav Nancy M | $680,000 | -- | |
| Mbt Rt | $404,000 | -- | |
| Vaishnav Nancy M | $680,000 | -- | |
| Mbt Rt | $404,000 | -- |
Source: Public Records
Mortgage History
| Date | Status | Borrower | Loan Amount |
|---|---|---|---|
| Previous Owner | Vaishnav Nancy M | $150,000 | |
| Previous Owner | Mbt Rt | $400,000 |
Source: Public Records
Tax History
| Year | Tax Paid | Tax Assessment Tax Assessment Total Assessment is a certain percentage of the fair market value that is determined by local assessors to be the total taxable value of land and additions on the property. | Land | Improvement |
|---|---|---|---|---|
| 2025 | $14,506 | $1,130,600 | $473,500 | $657,100 |
| 2024 | $14,026 | $1,061,000 | $455,500 | $605,500 |
| 2023 | $13,051 | $939,600 | $395,900 | $543,700 |
| 2022 | $12,063 | $834,200 | $366,700 | $467,500 |
| 2021 | $11,925 | $803,600 | $346,200 | $457,400 |
| 2020 | $11,547 | $770,300 | $336,900 | $433,400 |
| 2019 | $11,159 | $739,000 | $324,200 | $414,800 |
| 2018 | $10,985 | $719,400 | $311,700 | $407,700 |
| 2017 | $10,671 | $696,100 | $299,500 | $396,600 |
| 2016 | $10,682 | $686,500 | $308,800 | $377,700 |
| 2015 | $10,736 | $683,800 | $313,300 | $370,500 |
| 2014 | $10,383 | $658,800 | $313,300 | $345,500 |
Source: Public Records
Map
Nearby Homes
- 19 and 23 Arlington Ln
- 26 Dover Dr
- 241 Fisher St
- 8 Mckinley Ave
- 56 North St
- 291 Plimpton St
- 111 Elm St
- 260 Elm St
- 115 High St
- 881 Main St Unit 9
- 38 Garden Pkwy
- 222 School St Unit 9
- 224 School St Unit 9
- 26 Albemarle Rd
- 1110 Main St
- 15 Homestead Dr
- 50 Riverside Place
- 104 Wood End Ln
- 40 Endean Dr
- 363 - 367 Washington St
Your Personal Tour Guide
Ask me questions while you tour the home.