23 Blake St Needham, MA 02492
Needham AreaEstimated Value: $949,000 - $1,275,000
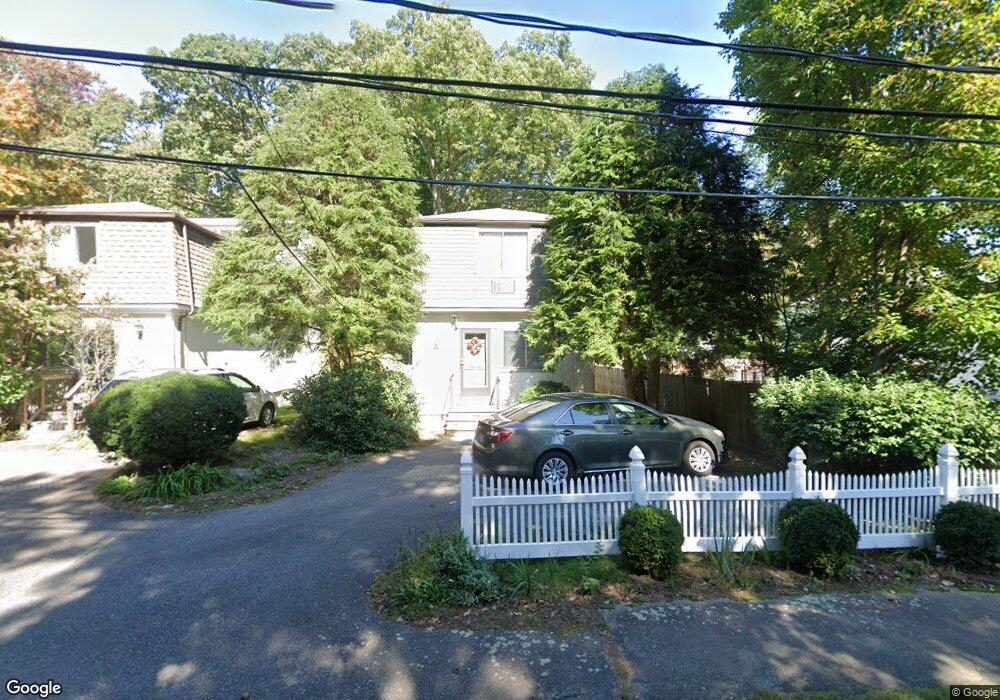
About This Home
This home is located at 23 Blake St, Needham, MA 02492 and is currently estimated at $1,072,899, approximately $1,085 per square foot. 23 Blake St is a home located in Norfolk County with nearby schools including Newman Elementary School, High Rock Middle School, and Pollard Middle School.
Ownership History
We collect this data history from publicly available records. To have your information removed, we recommend requesting removal directly through your county’s website.
Purchase Details
Home Values in the Area
Average Home Value in this Area
Purchase History
We collect this data history from publicly available records. To have your information removed, we recommend requesting removal directly through your county’s website.
| Date | Buyer | Sale Price | Title Company |
|---|---|---|---|
| $189,000 | -- |
Mortgage History
We collect this data history from publicly available records. To have your information removed, we recommend requesting removal directly through your county’s website.
| Date | Status | Borrower | Loan Amount |
|---|---|---|---|
| Open | $78,318 |
Tax History
We collect this data history from publicly available records. To have your information removed, we recommend requesting removal directly through your county’s website.
| Year | Tax Paid | Tax Assessment Tax Assessment Total Assessment is a certain percentage of the fair market value that is determined by local assessors to be the total taxable value of land and additions on the property. | Land | Improvement |
|---|---|---|---|---|
| 2025 | $7,995 | $754,200 | $532,500 | $221,700 |
| 2024 | $6,997 | $558,900 | $344,400 | $214,500 |
| 2023 | $7,069 | $542,100 | $344,400 | $197,700 |
| 2022 | $6,883 | $514,800 | $324,900 | $189,900 |
| 2021 | $6,708 | $514,800 | $324,900 | $189,900 |
| 2020 | $6,452 | $516,600 | $321,600 | $195,000 |
| 2019 | $6,010 | $485,100 | $292,400 | $192,700 |
| 2018 | $5,763 | $485,100 | $292,400 | $192,700 |
| 2017 | $5,480 | $460,900 | $292,400 | $168,500 |
| 2016 | $5,340 | $462,700 | $292,400 | $170,300 |
| 2015 | $5,224 | $462,700 | $292,400 | $170,300 |
| 2014 | $5,024 | $431,600 | $265,800 | $165,800 |
Map
- 109 Linden St
- 155 Oak St
- 105 Blake St
- 91 Henderson St
- 26 Denmark Ln Unit 26
- 456 Chestnut St
- 21 Gayland Rd
- 18 Grant St Unit Rear
- 287 High Rock St
- 430 High Rock St
- 61 Pleasant St
- 145 Meadowbrook Rd
- 211 High Rock St
- 46 Howland St Unit 46
- 533 Chestnut St
- 1333 Great Plain Ave
- 131 Fair Oaks Park
- 1362 Great Plain Ave Unit 1
- 1360 Great Plain Ave
- 89 May St Unit 4
Ask me questions while you tour the home.