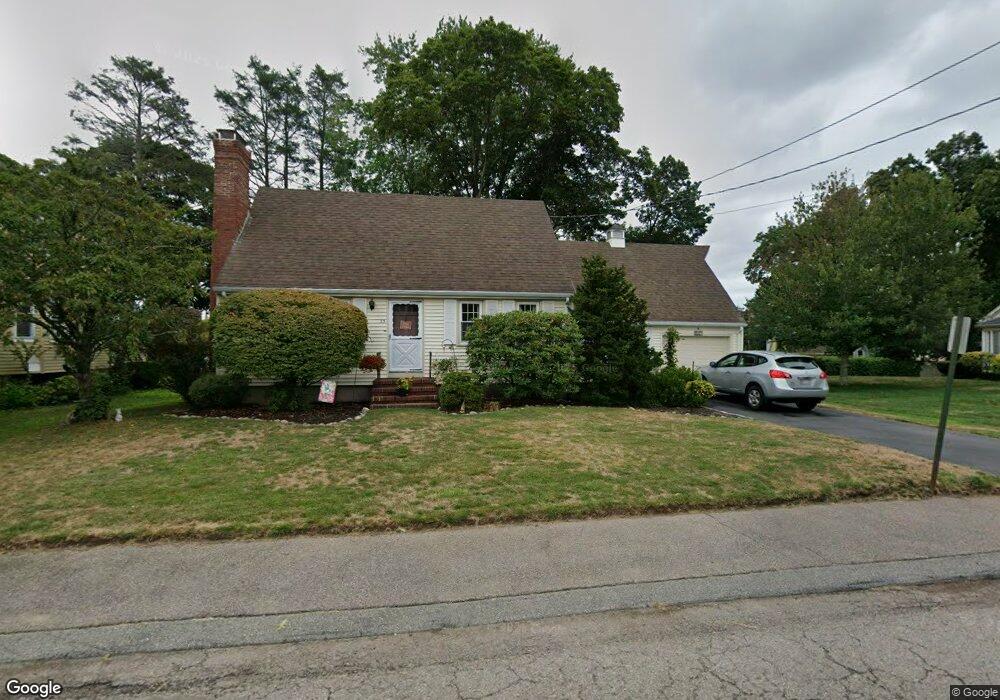
23 Brandon St North Attleboro, MA 02760
North Attleboro NeighborhoodEstimated Value: $494,000 - $525,000
3
Beds
1
Bath
1,328
Sq Ft
$379/Sq Ft
Est. Value
About This Home
This home is located at 23 Brandon St, North Attleboro, MA 02760 and is currently estimated at $502,969, approximately $378 per square foot. 23 Brandon St is a home located in Bristol County with nearby schools including North Attleboro High School, Cadence Academy Preschool - North Attleborough, and Bishop Feehan High School.
Ownership History
Date
Name
Owned For
Owner Type
Purchase Details
Closed on
Apr 18, 2007
Sold by
Parr Dale E and Walden John J
Bought by
Cole Kevin and Cole Pamela M
Current Estimated Value
Home Financials for this Owner
Home Financials are based on the most recent Mortgage that was taken out on this home.
Original Mortgage
$230,000
Outstanding Balance
$139,370
Interest Rate
6.19%
Mortgage Type
Purchase Money Mortgage
Estimated Equity
$363,599
Purchase Details
Closed on
Aug 21, 2003
Sold by
T W Nt
Bought by
Parr Dale E and Walden John J
Create a Home Valuation Report for This Property
The Home Valuation Report is an in-depth analysis detailing your home's value as well as a comparison with similar homes in the area
Home Values in the Area
Average Home Value in this Area
Purchase History
| Date | Buyer | Sale Price | Title Company |
|---|---|---|---|
| Cole Kevin | $310,500 | -- | |
| Parr Dale E | -- | -- |
Source: Public Records
Mortgage History
| Date | Status | Borrower | Loan Amount |
|---|---|---|---|
| Open | Cole Kevin | $230,000 |
Source: Public Records
Tax History Compared to Growth
Tax History
| Year | Tax Paid | Tax Assessment Tax Assessment Total Assessment is a certain percentage of the fair market value that is determined by local assessors to be the total taxable value of land and additions on the property. | Land | Improvement |
|---|---|---|---|---|
| 2025 | $4,813 | $408,200 | $110,800 | $297,400 |
| 2024 | $4,610 | $399,500 | $110,800 | $288,700 |
| 2023 | $4,672 | $365,300 | $110,800 | $254,500 |
| 2022 | $4,329 | $310,800 | $110,800 | $200,000 |
| 2021 | $4,154 | $291,100 | $110,800 | $180,300 |
| 2020 | $4,048 | $282,100 | $110,800 | $171,300 |
| 2019 | $3,873 | $272,000 | $100,700 | $171,300 |
| 2018 | $3,447 | $258,400 | $100,700 | $157,700 |
| 2017 | $3,197 | $241,800 | $100,700 | $141,100 |
| 2016 | $3,265 | $247,000 | $111,900 | $135,100 |
| 2015 | $3,060 | $232,900 | $117,500 | $115,400 |
| 2014 | $2,926 | $221,000 | $108,600 | $112,400 |
Source: Public Records
Map
Nearby Homes
- 93 Bank St
- 85 Richards Ave
- 151 Roosevelt Ave Unit A
- 16 Richards Ave Unit 106
- 19 Church St Unit A5
- 99 Arnold Rd
- 33 Ash St
- 12 Roosevelt Ave
- 20 Holbrook Ave
- 80 Broadway Unit 9
- 60 Crescent Ave
- 16 Johnson St
- 58 Jay St
- 160 Crescent Ave
- 19 Metcalf Cir
- 300 E Washington St Unit 4M
- 300 E Washington St Unit 54R
- 68 Fisher St
- 50 Metcalf Rd
- 20 South St