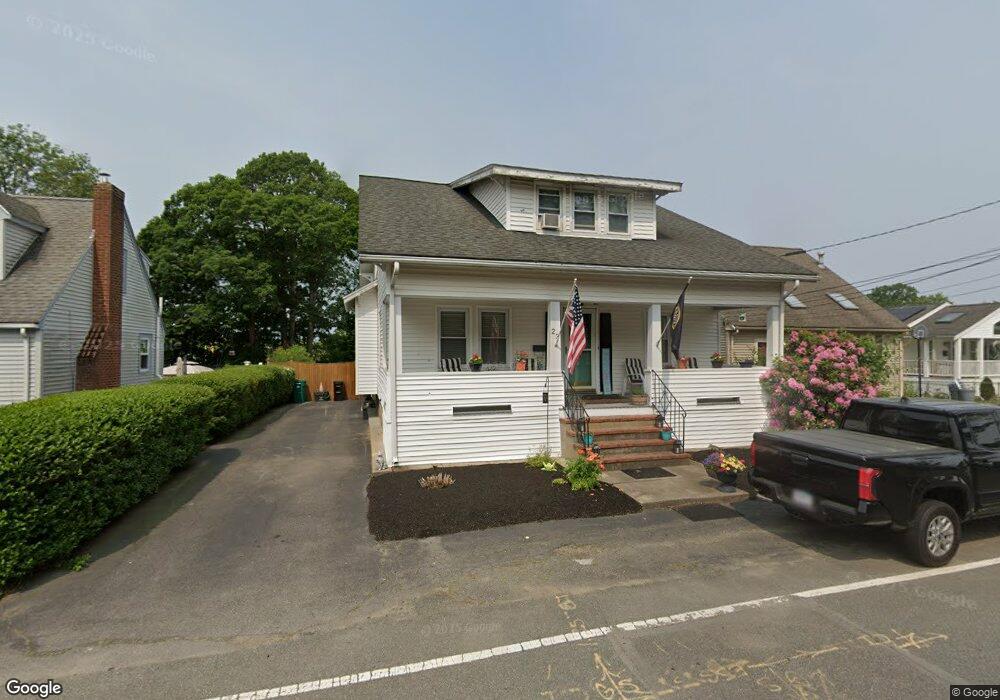
23 Breer St Brockton, MA 02301
Clifton Heights NeighborhoodEstimated Value: $505,000 - $559,000
3
Beds
2
Baths
1,648
Sq Ft
$328/Sq Ft
Est. Value
About This Home
This home is located at 23 Breer St, Brockton, MA 02301 and is currently estimated at $540,267, approximately $327 per square foot. 23 Breer St is a home located in Plymouth County with nearby schools including Gilmore Elementary School, John F. Kennedy Elementary School, and Davis K-8 School.
Ownership History
Date
Name
Owned For
Owner Type
Purchase Details
Closed on
Jun 15, 2012
Sold by
Reilly Joseph L
Bought by
Reilly Joseph L and Reilly Kelly A
Current Estimated Value
Home Financials for this Owner
Home Financials are based on the most recent Mortgage that was taken out on this home.
Original Mortgage
$120,000
Outstanding Balance
$51,124
Interest Rate
3.85%
Mortgage Type
New Conventional
Estimated Equity
$489,143
Purchase Details
Closed on
May 20, 1994
Sold by
Manzo Anthony M and Manzo Michael A
Bought by
Reilly Joseph L
Home Financials for this Owner
Home Financials are based on the most recent Mortgage that was taken out on this home.
Original Mortgage
$89,775
Interest Rate
8.44%
Mortgage Type
Purchase Money Mortgage
Create a Home Valuation Report for This Property
The Home Valuation Report is an in-depth analysis detailing your home's value as well as a comparison with similar homes in the area
Home Values in the Area
Average Home Value in this Area
Purchase History
| Date | Buyer | Sale Price | Title Company |
|---|---|---|---|
| Reilly Joseph L | -- | -- | |
| Reilly Joseph L | $92,000 | -- |
Source: Public Records
Mortgage History
| Date | Status | Borrower | Loan Amount |
|---|---|---|---|
| Open | Reilly Joseph L | $120,000 | |
| Previous Owner | Reilly Joseph L | $124,000 | |
| Previous Owner | Reilly Joseph L | $120,000 | |
| Previous Owner | Reilly Joseph L | $89,775 |
Source: Public Records
Tax History Compared to Growth
Tax History
| Year | Tax Paid | Tax Assessment Tax Assessment Total Assessment is a certain percentage of the fair market value that is determined by local assessors to be the total taxable value of land and additions on the property. | Land | Improvement |
|---|---|---|---|---|
| 2025 | $5,550 | $458,300 | $144,000 | $314,300 |
| 2024 | $5,503 | $457,800 | $144,000 | $313,800 |
| 2023 | $5,175 | $398,700 | $108,700 | $290,000 |
| 2022 | $4,768 | $341,300 | $98,700 | $242,600 |
| 2021 | $4,546 | $313,500 | $91,300 | $222,200 |
| 2020 | $4,948 | $326,600 | $87,700 | $238,900 |
| 2019 | $4,827 | $310,600 | $81,100 | $229,500 |
| 2018 | $4,325 | $269,300 | $81,100 | $188,200 |
| 2017 | $4,134 | $256,800 | $81,100 | $175,700 |
| 2016 | $3,875 | $223,200 | $77,300 | $145,900 |
| 2015 | $3,666 | $202,000 | $77,300 | $124,700 |
| 2014 | $3,559 | $196,300 | $77,300 | $119,000 |
Source: Public Records
Map
Nearby Homes