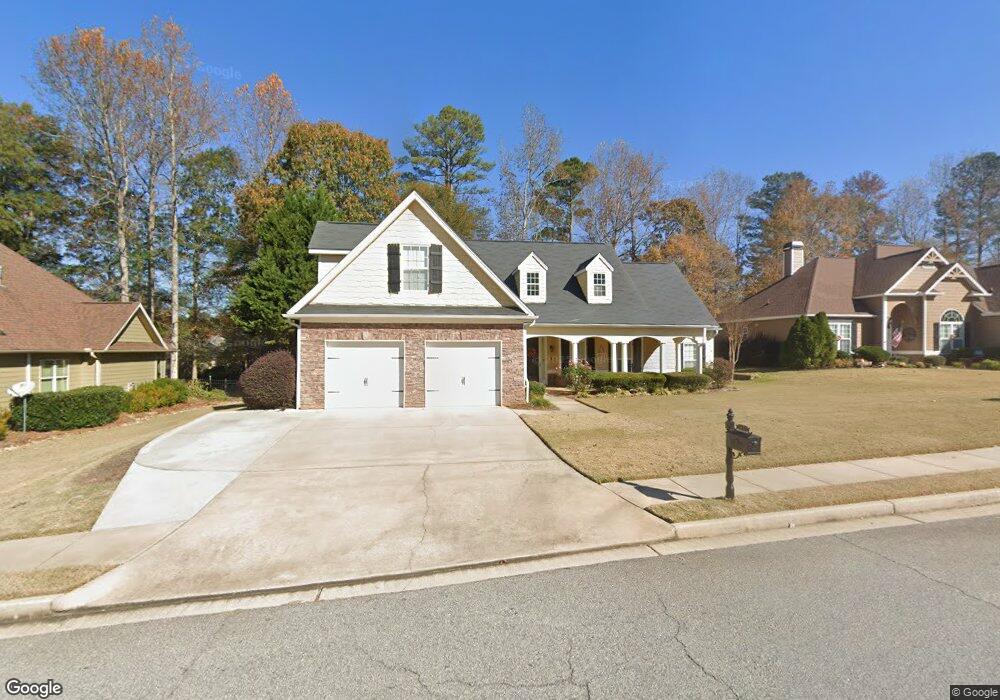
23 Briarpatch Ln Newnan, GA 30265
Summergrove NeighborhoodEstimated Value: $490,000 - $601,000
4
Beds
3
Baths
2,448
Sq Ft
$217/Sq Ft
Est. Value
About This Home
This home is located at 23 Briarpatch Ln, Newnan, GA 30265 and is currently estimated at $532,172, approximately $217 per square foot. 23 Briarpatch Ln is a home located in Coweta County with nearby schools including Welch Elementary School, Lee Middle School, and East Coweta High School.
Ownership History
Date
Name
Owned For
Owner Type
Purchase Details
Closed on
Sep 14, 2018
Sold by
Conover Ralph J
Bought by
Teague Ryan S and Teague Staci E
Current Estimated Value
Home Financials for this Owner
Home Financials are based on the most recent Mortgage that was taken out on this home.
Original Mortgage
$285,600
Outstanding Balance
$212,096
Interest Rate
4.5%
Mortgage Type
New Conventional
Estimated Equity
$320,076
Purchase Details
Closed on
Sep 25, 2006
Sold by
Prestigious Homes Inc
Bought by
Conover Ralbp J and Conover Lois C
Home Financials for this Owner
Home Financials are based on the most recent Mortgage that was taken out on this home.
Original Mortgage
$220,000
Interest Rate
6.13%
Mortgage Type
New Conventional
Purchase Details
Closed on
Sep 30, 2005
Sold by
Peachtree City Holdings
Bought by
Prestigious Homes Inc
Purchase Details
Closed on
Jan 25, 2000
Bought by
Peachtree City Holdings
Create a Home Valuation Report for This Property
The Home Valuation Report is an in-depth analysis detailing your home's value as well as a comparison with similar homes in the area
Home Values in the Area
Average Home Value in this Area
Purchase History
| Date | Buyer | Sale Price | Title Company |
|---|---|---|---|
| Teague Ryan S | $357,000 | -- | |
| Conover Ralbp J | $262,000 | -- | |
| Prestigious Homes Inc | $686,000 | -- | |
| Peachtree City Holdings | -- | -- |
Source: Public Records
Mortgage History
| Date | Status | Borrower | Loan Amount |
|---|---|---|---|
| Open | Teague Ryan S | $285,600 | |
| Previous Owner | Conover Ralbp J | $220,000 |
Source: Public Records
Tax History Compared to Growth
Tax History
| Year | Tax Paid | Tax Assessment Tax Assessment Total Assessment is a certain percentage of the fair market value that is determined by local assessors to be the total taxable value of land and additions on the property. | Land | Improvement |
|---|---|---|---|---|
| 2025 | $4,372 | $185,818 | $44,000 | $141,818 |
| 2024 | $4,164 | $185,638 | $44,000 | $141,638 |
| 2023 | $4,164 | $165,366 | $38,000 | $127,366 |
| 2022 | $3,779 | $158,824 | $38,000 | $120,824 |
| 2021 | $3,367 | $128,836 | $32,000 | $96,836 |
| 2020 | $3,441 | $128,836 | $32,000 | $96,836 |
| 2019 | $3,489 | $119,880 | $24,000 | $95,880 |
| 2018 | $1,812 | $111,692 | $24,000 | $87,692 |
| 2017 | $2,169 | $111,692 | $24,000 | $87,692 |
| 2016 | $1,938 | $103,897 | $24,000 | $79,897 |
| 2015 | $1,880 | $101,949 | $24,000 | $77,949 |
| 2014 | $2,540 | $101,949 | $24,000 | $77,949 |
Source: Public Records
Map
Nearby Homes
- 161 Lake Shore Dr
- 185 Lake Shore Dr
- 69 Arbor Way
- 43 Beacon Crest
- 64 Gables Way
- 100 Arbor Way
- 15 Downing Ct
- 6 Eagle Ct
- 233 Horizon Hill
- 49 Leverett Dr
- 39 Rollingbrook Vista
- 30 Oak Shores Dr
- 460 Vanderbilt Pkwy
- 3 Briar Grove
- 415 Vanderbilt Pkwy
- 15 Oak Shores Dr
- 46 Greenview Dr
- 62 Greenview Dr
- 41 Briar Grove
- 18 Berkeley Park
- 19 Briarpatch Ln
- 27 Briarpatch Ln
- 140 Fairgreen Trace
- 15 Briarpatch Ln
- 2 Ridgebriar Ln Unit 36
- 2 Ridgebriar Ln
- 31 Briarpatch Ln
- 3 Ridgebriar Ln
- 11 Briarpatch Ln
- 138 Fairgreen Trace
- 4 Ridgebriar Ln
- 9 Ridgebriar Ln
- 12 Briarpatch Ln
- 26 Briarpatch Ln
- 7 Briarpatch Ln
- 8 Briarpatch Ln
- 30 Briarpatch Ln
- 10 Ridgebriar Ln
- 15 Ridgebriar Ln Unit 24
- 15 Ridgebriar Ln