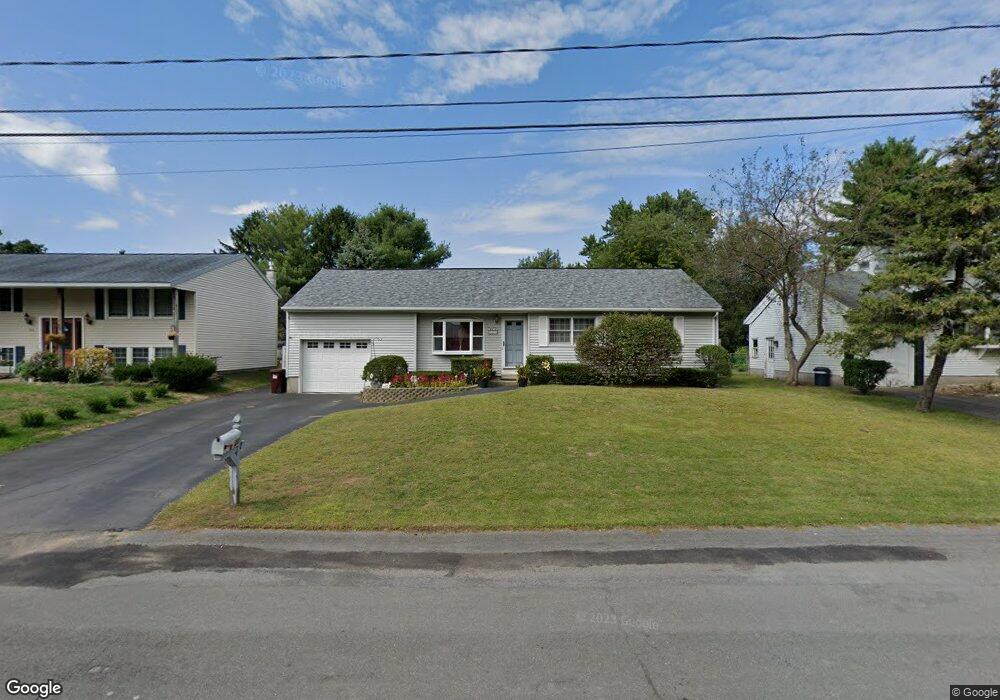
23 Brickley Dr Albany, NY 12205
Estimated Value: $308,000 - $361,000
3
Beds
1
Bath
1,233
Sq Ft
$274/Sq Ft
Est. Value
About This Home
This home is located at 23 Brickley Dr, Albany, NY 12205 and is currently estimated at $337,479, approximately $273 per square foot. 23 Brickley Dr is a home located in Albany County with nearby schools including Roessleville School, Sand Creek Middle School, and Colonie Central High School.
Ownership History
Date
Name
Owned For
Owner Type
Purchase Details
Closed on
Mar 10, 2025
Sold by
Wahl John C and Wahl Patricia C
Bought by
Bollacker Matthew and Bollacker James
Current Estimated Value
Home Financials for this Owner
Home Financials are based on the most recent Mortgage that was taken out on this home.
Original Mortgage
$256,500
Outstanding Balance
$254,517
Interest Rate
6.25%
Mortgage Type
New Conventional
Estimated Equity
$82,962
Purchase Details
Closed on
Apr 5, 2004
Sold by
Kelly Genevieve
Bought by
Wahl John C
Create a Home Valuation Report for This Property
The Home Valuation Report is an in-depth analysis detailing your home's value as well as a comparison with similar homes in the area
Home Values in the Area
Average Home Value in this Area
Purchase History
| Date | Buyer | Sale Price | Title Company |
|---|---|---|---|
| Bollacker Matthew | $270,000 | None Listed On Document | |
| Wahl John C | $167,000 | Karen A Hoblock |
Source: Public Records
Mortgage History
| Date | Status | Borrower | Loan Amount |
|---|---|---|---|
| Open | Bollacker Matthew | $256,500 |
Source: Public Records
Tax History
| Year | Tax Paid | Tax Assessment Tax Assessment Total Assessment is a certain percentage of the fair market value that is determined by local assessors to be the total taxable value of land and additions on the property. | Land | Improvement |
|---|---|---|---|---|
| 2024 | $5,209 | $113,000 | $28,200 | $84,800 |
| 2023 | $5,042 | $113,000 | $28,200 | $84,800 |
| 2022 | $4,945 | $113,000 | $28,200 | $84,800 |
| 2021 | $4,878 | $113,000 | $28,200 | $84,800 |
| 2020 | $4,760 | $113,000 | $28,200 | $84,800 |
| 2019 | $2,374 | $113,000 | $28,200 | $84,800 |
| 2018 | $4,634 | $113,000 | $28,200 | $84,800 |
| 2017 | $0 | $113,000 | $28,200 | $84,800 |
| 2016 | $4,571 | $113,000 | $28,200 | $84,800 |
| 2015 | -- | $113,000 | $28,200 | $84,800 |
| 2014 | -- | $113,000 | $28,200 | $84,800 |
Source: Public Records
Map
Nearby Homes