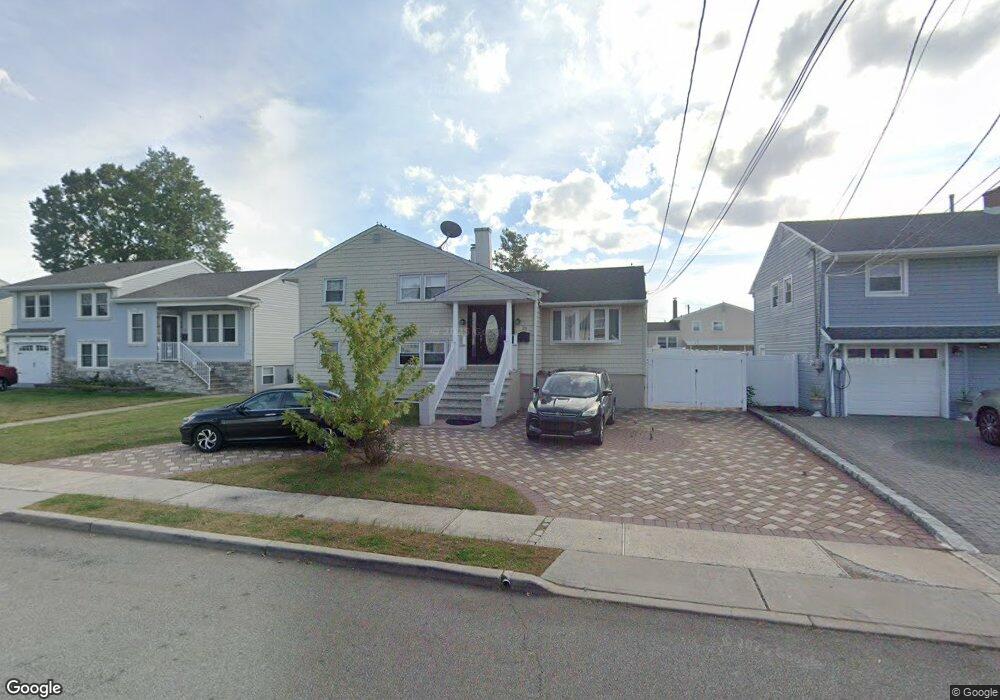
23 Capp St Carteret, NJ 07008
Estimated Value: $579,000 - $701,000
--
Bed
--
Bath
1,832
Sq Ft
$345/Sq Ft
Est. Value
About This Home
This home is located at 23 Capp St, Carteret, NJ 07008 and is currently estimated at $631,663, approximately $344 per square foot. 23 Capp St is a home located in Middlesex County with nearby schools including Carteret High School and St Joseph School.
Ownership History
Date
Name
Owned For
Owner Type
Purchase Details
Closed on
Oct 22, 2007
Sold by
Munawar Farzan
Bought by
Altaf Zahid
Current Estimated Value
Home Financials for this Owner
Home Financials are based on the most recent Mortgage that was taken out on this home.
Original Mortgage
$399,000
Outstanding Balance
$251,433
Interest Rate
6.39%
Mortgage Type
Purchase Money Mortgage
Estimated Equity
$380,230
Purchase Details
Closed on
Jul 11, 2006
Sold by
Olivares Luis
Bought by
Farzan Munawar
Home Financials for this Owner
Home Financials are based on the most recent Mortgage that was taken out on this home.
Original Mortgage
$312,000
Interest Rate
6.67%
Create a Home Valuation Report for This Property
The Home Valuation Report is an in-depth analysis detailing your home's value as well as a comparison with similar homes in the area
Home Values in the Area
Average Home Value in this Area
Purchase History
| Date | Buyer | Sale Price | Title Company |
|---|---|---|---|
| Altaf Zahid | $420,000 | Stewart Title Guaranty Co | |
| Farzan Munawar | $390,000 | -- |
Source: Public Records
Mortgage History
| Date | Status | Borrower | Loan Amount |
|---|---|---|---|
| Open | Altaf Zahid | $399,000 | |
| Previous Owner | Farzan Munawar | $312,000 |
Source: Public Records
Tax History Compared to Growth
Tax History
| Year | Tax Paid | Tax Assessment Tax Assessment Total Assessment is a certain percentage of the fair market value that is determined by local assessors to be the total taxable value of land and additions on the property. | Land | Improvement |
|---|---|---|---|---|
| 2025 | $9,226 | $589,800 | $356,500 | $233,300 |
| 2024 | $8,989 | $289,400 | $130,000 | $159,400 |
| 2023 | $8,989 | $289,400 | $130,000 | $159,400 |
| 2022 | $8,740 | $289,400 | $130,000 | $159,400 |
| 2021 | $6,404 | $289,400 | $130,000 | $159,400 |
| 2020 | $8,323 | $289,400 | $130,000 | $159,400 |
| 2019 | $8,083 | $289,400 | $130,000 | $159,400 |
| 2018 | $7,892 | $289,400 | $130,000 | $159,400 |
| 2017 | $7,611 | $289,400 | $130,000 | $159,400 |
| 2016 | $7,411 | $229,600 | $95,000 | $134,600 |
| 2015 | $7,166 | $229,600 | $95,000 | $134,600 |
| 2014 | $6,854 | $229,600 | $95,000 | $134,600 |
Source: Public Records
Map
Nearby Homes