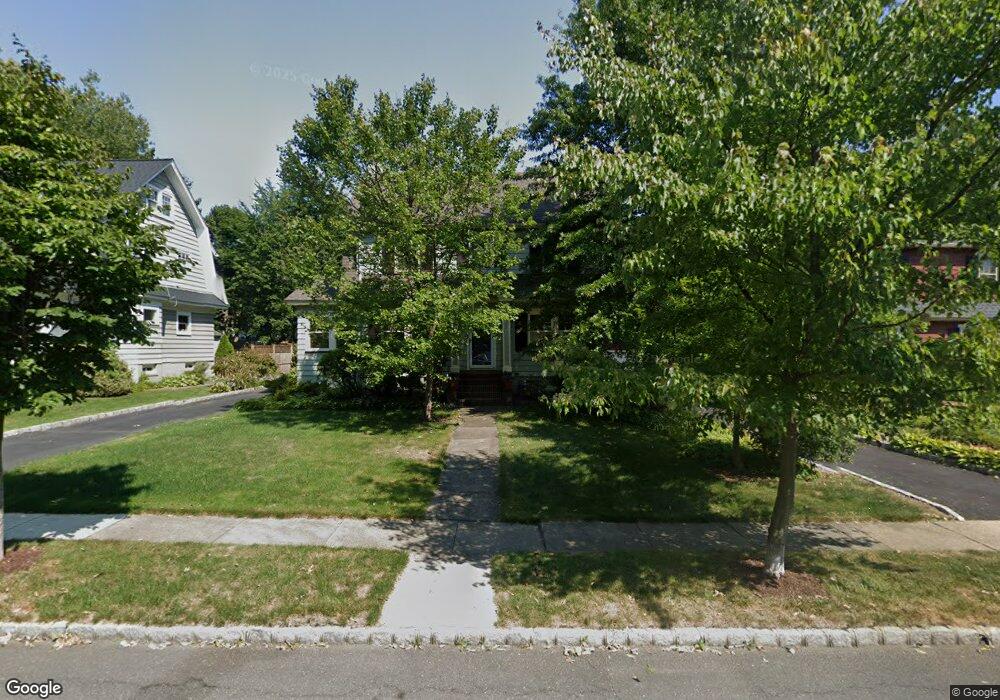
23 Carolin Rd Montclair, NJ 07043
Estimated Value: $1,150,000 - $1,405,000
--
Bed
--
Bath
1,800
Sq Ft
$690/Sq Ft
Est. Value
About This Home
This home is located at 23 Carolin Rd, Montclair, NJ 07043 and is currently estimated at $1,241,530, approximately $689 per square foot. 23 Carolin Rd is a home located in Essex County with nearby schools including Bradford School, Hillside School, and Nishuane School.
Ownership History
Date
Name
Owned For
Owner Type
Purchase Details
Closed on
Jan 11, 1994
Sold by
Szep Steven
Bought by
Karas Michael and Karas Andra
Current Estimated Value
Home Financials for this Owner
Home Financials are based on the most recent Mortgage that was taken out on this home.
Original Mortgage
$164,000
Interest Rate
7.23%
Purchase Details
Closed on
Jul 13, 1988
Sold by
Kiernan Kevin M
Bought by
Szep Steven
Create a Home Valuation Report for This Property
The Home Valuation Report is an in-depth analysis detailing your home's value as well as a comparison with similar homes in the area
Home Values in the Area
Average Home Value in this Area
Purchase History
| Date | Buyer | Sale Price | Title Company |
|---|---|---|---|
| Karas Michael | $205,000 | -- | |
| Szep Steven | $245,000 | -- |
Source: Public Records
Mortgage History
| Date | Status | Borrower | Loan Amount |
|---|---|---|---|
| Closed | Karas Michael | $164,000 |
Source: Public Records
Tax History Compared to Growth
Tax History
| Year | Tax Paid | Tax Assessment Tax Assessment Total Assessment is a certain percentage of the fair market value that is determined by local assessors to be the total taxable value of land and additions on the property. | Land | Improvement |
|---|---|---|---|---|
| 2025 | $22,061 | $652,700 | $367,400 | $285,300 |
| 2024 | $22,061 | $652,700 | $367,400 | $285,300 |
| 2022 | $21,461 | $652,700 | $367,400 | $285,300 |
| 2021 | $21,089 | $652,700 | $367,400 | $285,300 |
| 2020 | $20,749 | $652,700 | $367,400 | $285,300 |
| 2019 | $20,534 | $652,700 | $367,400 | $285,300 |
| 2018 | $19,997 | $646,300 | $367,400 | $278,900 |
| 2017 | $18,551 | $496,800 | $328,800 | $168,000 |
| 2016 | $17,967 | $494,400 | $328,800 | $165,600 |
| 2015 | $17,433 | $494,400 | $328,800 | $165,600 |
| 2014 | $16,849 | $494,400 | $328,800 | $165,600 |
Source: Public Records
Map
Nearby Homes