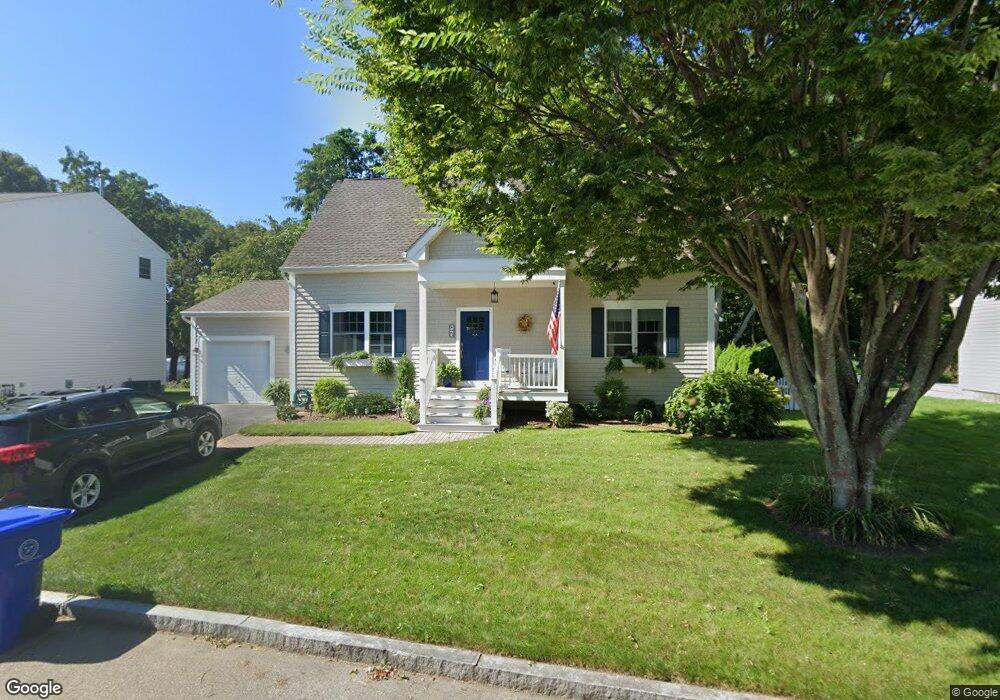
23 Carousel Dr Riverside, RI 02915
Riverside NeighborhoodEstimated Value: $772,863 - $1,004,000
4
Beds
2
Baths
2,670
Sq Ft
$314/Sq Ft
Est. Value
About This Home
This home is located at 23 Carousel Dr, Riverside, RI 02915 and is currently estimated at $837,216, approximately $313 per square foot. 23 Carousel Dr is a home located in Providence County with nearby schools including East Providence High School, St Luke Elementary School, and St Mary Academy-Bay View.
Ownership History
Date
Name
Owned For
Owner Type
Purchase Details
Closed on
May 22, 2008
Sold by
Wilson Alexander H and Wilson Kathleen
Bought by
Sheridan Steven M and Sheridan Ellen M
Current Estimated Value
Purchase Details
Closed on
Jan 16, 2001
Sold by
Jgp Builders
Bought by
Jarret Aram P and Jarret Diane
Create a Home Valuation Report for This Property
The Home Valuation Report is an in-depth analysis detailing your home's value as well as a comparison with similar homes in the area
Home Values in the Area
Average Home Value in this Area
Purchase History
| Date | Buyer | Sale Price | Title Company |
|---|---|---|---|
| Sheridan Steven M | $370,000 | -- | |
| Jarret Aram P | $248,000 | -- | |
| Sheridan Steven M | $370,000 | -- | |
| Jarret Aram P | $248,000 | -- |
Source: Public Records
Mortgage History
| Date | Status | Borrower | Loan Amount |
|---|---|---|---|
| Open | Jarret Aram P | $203,500 | |
| Closed | Jarret Aram P | $239,770 | |
| Closed | Jarret Aram P | $39,500 |
Source: Public Records
Tax History
| Year | Tax Paid | Tax Assessment Tax Assessment Total Assessment is a certain percentage of the fair market value that is determined by local assessors to be the total taxable value of land and additions on the property. | Land | Improvement |
|---|---|---|---|---|
| 2025 | $9,755 | $746,400 | $325,700 | $420,700 |
| 2024 | $8,916 | $581,600 | $271,400 | $310,200 |
| 2023 | $8,584 | $581,600 | $271,400 | $310,200 |
| 2022 | $9,205 | $421,100 | $177,300 | $243,800 |
| 2021 | $9,054 | $421,100 | $177,000 | $244,100 |
| 2020 | $8,670 | $421,100 | $177,000 | $244,100 |
| 2019 | $8,402 | $419,700 | $177,000 | $242,700 |
| 2018 | $8,273 | $361,600 | $153,300 | $208,300 |
| 2017 | $8,089 | $361,600 | $153,300 | $208,300 |
| 2016 | $8,049 | $361,600 | $153,300 | $208,300 |
| 2015 | $7,209 | $314,100 | $111,800 | $202,300 |
| 2014 | $7,209 | $314,100 | $111,800 | $202,300 |
Source: Public Records
Map
Nearby Homes
Your Personal Tour Guide
Ask me questions while you tour the home.