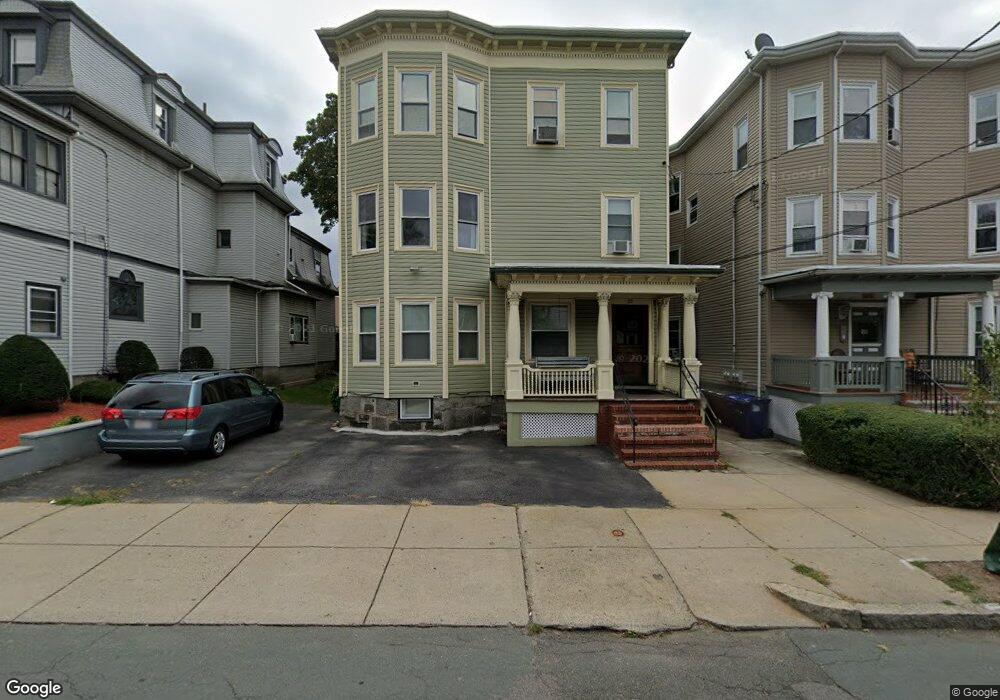
23 Cary Ave Unit 2 Chelsea, MA 02150
Broadway NeighborhoodEstimated Value: $430,000 - $513,000
2
Beds
1
Bath
1,732
Sq Ft
$281/Sq Ft
Est. Value
About This Home
This home is located at 23 Cary Ave Unit 2, Chelsea, MA 02150 and is currently estimated at $486,071, approximately $280 per square foot. 23 Cary Ave Unit 2 is a home located in Suffolk County with nearby schools including Chelsea High School and Phoenix Charter Academy - Chelsea.
Ownership History
Date
Name
Owned For
Owner Type
Purchase Details
Closed on
Sep 28, 2020
Sold by
Dwyer Mary R and Barry Dwyer J
Bought by
Dwyer Andrew P and Dwyer Stephanie
Current Estimated Value
Home Financials for this Owner
Home Financials are based on the most recent Mortgage that was taken out on this home.
Original Mortgage
$200,000
Outstanding Balance
$177,889
Interest Rate
2.9%
Mortgage Type
New Conventional
Estimated Equity
$308,182
Purchase Details
Closed on
Jul 16, 2018
Sold by
Dwyer Mary R
Bought by
Dwyer Mary R and Barry Dwyer J
Purchase Details
Closed on
Nov 21, 1991
Sold by
Donarumo Andrew and Donarumo Toni
Bought by
Dwyer Mary R
Purchase Details
Closed on
Apr 17, 1987
Sold by
Williams Denise P
Bought by
Donarumo Andrew M
Create a Home Valuation Report for This Property
The Home Valuation Report is an in-depth analysis detailing your home's value as well as a comparison with similar homes in the area
Home Values in the Area
Average Home Value in this Area
Purchase History
| Date | Buyer | Sale Price | Title Company |
|---|---|---|---|
| Dwyer Andrew P | $250,000 | None Available | |
| Dwyer Andrew P | $250,000 | None Available | |
| Dwyer Mary R | -- | -- | |
| Dwyer Mary R | -- | -- | |
| Dwyer Mary R | $80,000 | -- | |
| Dwyer Mary R | $80,000 | -- | |
| Donarumo Andrew M | $33,000 | -- |
Source: Public Records
Mortgage History
| Date | Status | Borrower | Loan Amount |
|---|---|---|---|
| Open | Dwyer Andrew P | $200,000 | |
| Closed | Dwyer Andrew P | $200,000 | |
| Previous Owner | Donarumo Andrew M | $10,000 | |
| Previous Owner | Donarumo Andrew M | $25,000 | |
| Previous Owner | Donarumo Andrew M | $80,000 |
Source: Public Records
Tax History Compared to Growth
Tax History
| Year | Tax Paid | Tax Assessment Tax Assessment Total Assessment is a certain percentage of the fair market value that is determined by local assessors to be the total taxable value of land and additions on the property. | Land | Improvement |
|---|---|---|---|---|
| 2025 | $5,509 | $478,600 | $0 | $478,600 |
| 2024 | $5,460 | $458,800 | $0 | $458,800 |
| 2023 | $5,210 | $420,800 | $0 | $420,800 |
| 2022 | $5,352 | $403,900 | $0 | $403,900 |
| 2021 | $5,271 | $387,000 | $0 | $387,000 |
| 2020 | $4,976 | $371,600 | $0 | $371,600 |
| 2019 | $3,682 | $258,400 | $0 | $258,400 |
| 2018 | $3,392 | $240,600 | $0 | $240,600 |
| 2017 | $3,238 | $225,800 | $0 | $225,800 |
| 2016 | $2,632 | $184,700 | $0 | $184,700 |
| 2015 | $2,642 | $183,500 | $0 | $183,500 |
| 2014 | $2,385 | $160,300 | $0 | $160,300 |
Source: Public Records
Map
Nearby Homes
- 39 Cary Ave Unit 14
- 40 Crescent Ave Unit 2
- 40 Crescent Ave Unit 3
- 105 Washington Ave
- 35 Eden St
- 33 John St
- 796 Broadway
- 55 Eleanor St Unit 17
- 65 6th St
- 78 Addison St Unit B
- 827 Broadway
- 221 Shurtleff St Unit 1
- 221 Shurtleff St Unit 2
- 837 Broadway
- 7 Carmel St
- 21 Crest Ave
- 115 Addison St
- 275 Washington Ave Unit 2
- 70 Warren Ave Unit 4-1
- 124 Addison St Unit 7
- 23 Cary Ave Unit 1A
- 23 Cary Ave Unit 3
- 23 Cary Ave Unit 1
- 23 Cary Ave Unit B
- 23 Cary Ave Unit 1,23
- 25 Cary Ave Unit 1
- 25 Cary Ave
- 25 Cary Ave Unit 3
- 19 Cary Ave
- 17 Cary Ave
- 17 Lawrence St
- 21 Lawrence St
- 15 Lawrence St
- 11 Lawrence St
- 29 Cary Ave
- 24 Cary Ave
- 22 Cary Ave
- 20 Cary Ave
- 26 Cary Ave
- 26 Cary Ave Unit 1