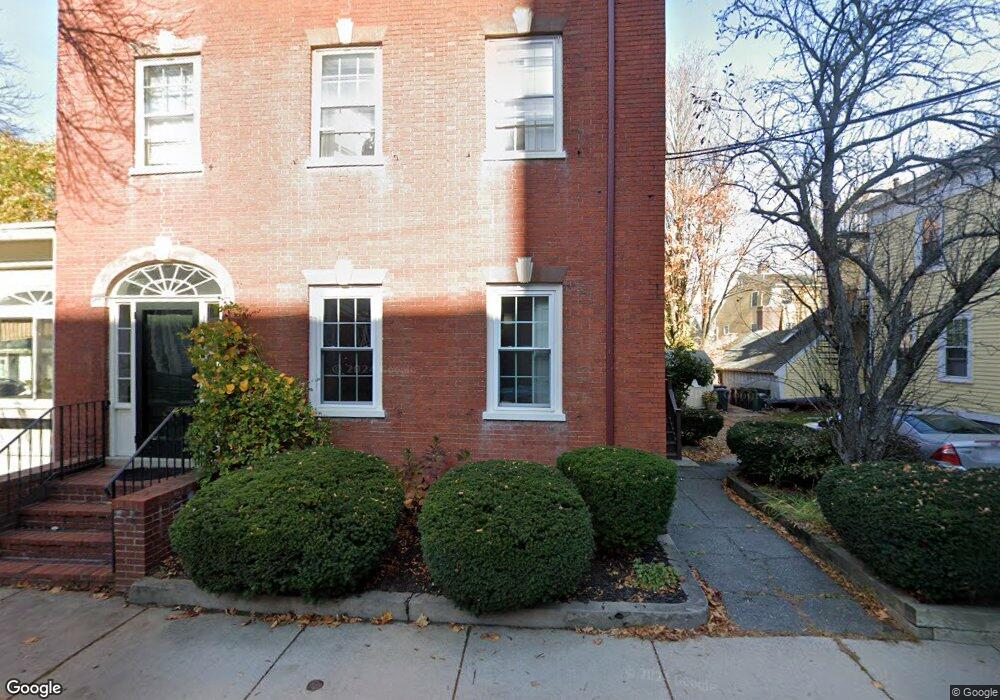
23 Charter St Unit 4 Newburyport, MA 01950
Estimated Value: $497,404 - $667,000
2
Beds
1
Bath
1,013
Sq Ft
$581/Sq Ft
Est. Value
About This Home
This home is located at 23 Charter St Unit 4, Newburyport, MA 01950 and is currently estimated at $588,851, approximately $581 per square foot. 23 Charter St Unit 4 is a home located in Essex County with nearby schools including Francis T. Bresnahan Elementary School, Edward G. Molin Elementary School, and Rupert A. Nock Middle School.
Ownership History
Date
Name
Owned For
Owner Type
Purchase Details
Closed on
Jun 3, 2011
Sold by
Curtis Cynthia J
Bought by
Clabcy Todd A
Current Estimated Value
Home Financials for this Owner
Home Financials are based on the most recent Mortgage that was taken out on this home.
Original Mortgage
$255,272
Outstanding Balance
$177,785
Interest Rate
4.85%
Estimated Equity
$411,066
Purchase Details
Closed on
Sep 24, 2004
Sold by
Miller Erin R
Bought by
Curtis Cynthia J
Home Financials for this Owner
Home Financials are based on the most recent Mortgage that was taken out on this home.
Original Mortgage
$208,000
Interest Rate
5.89%
Mortgage Type
Purchase Money Mortgage
Purchase Details
Closed on
Apr 8, 2003
Sold by
Kroll Jeri
Bought by
Miller Erin R
Purchase Details
Closed on
Sep 3, 1998
Sold by
Kantak Gregory and Kantak Josee
Bought by
Kroli Jeri
Purchase Details
Closed on
Oct 13, 1995
Sold by
Ortiz L Joyce
Bought by
Kantak Gregory and Francher Josee
Purchase Details
Closed on
Jul 3, 1991
Sold by
Woodward Jeffrey D
Bought by
Ortiz L Joyce
Create a Home Valuation Report for This Property
The Home Valuation Report is an in-depth analysis detailing your home's value as well as a comparison with similar homes in the area
Home Values in the Area
Average Home Value in this Area
Purchase History
| Date | Buyer | Sale Price | Title Company |
|---|---|---|---|
| Clabcy Todd A | $255,000 | -- | |
| Curtis Cynthia J | $283,000 | -- | |
| Miller Erin R | $240,000 | -- | |
| Kroli Jeri | $125,000 | -- | |
| Kantak Gregory | $104,500 | -- | |
| Ortiz L Joyce | $80,000 | -- |
Source: Public Records
Mortgage History
| Date | Status | Borrower | Loan Amount |
|---|---|---|---|
| Open | Ortiz L Joyce | $255,272 | |
| Previous Owner | Ortiz L Joyce | $208,000 |
Source: Public Records
Tax History Compared to Growth
Tax History
| Year | Tax Paid | Tax Assessment Tax Assessment Total Assessment is a certain percentage of the fair market value that is determined by local assessors to be the total taxable value of land and additions on the property. | Land | Improvement |
|---|---|---|---|---|
| 2025 | $3,820 | $398,700 | $0 | $398,700 |
| 2024 | $3,727 | $373,800 | $0 | $373,800 |
| 2023 | $3,709 | $345,300 | $0 | $345,300 |
| 2022 | $3,615 | $301,000 | $0 | $301,000 |
| 2021 | $4,750 | $375,800 | $0 | $375,800 |
| 2020 | $4,729 | $368,300 | $0 | $368,300 |
| 2019 | $4,309 | $329,400 | $0 | $329,400 |
| 2018 | $4,237 | $319,500 | $0 | $319,500 |
| 2017 | $4,106 | $305,300 | $0 | $305,300 |
| 2016 | $3,860 | $288,300 | $0 | $288,300 |
| 2015 | $3,408 | $255,500 | $0 | $255,500 |
Source: Public Records
Map
Nearby Homes
- 11 Charter St
- 10 10th St
- 105 State St Unit 301
- 105 State St Unit 101
- 105 State St Unit 201
- 42 Federal St Unit B
- 30-32 Water St Unit 4
- 95 High St Unit 4
- 95 High St Unit 1
- 58 Lime St Unit 5
- 2 Court St Unit 4
- 57 Lime St Unit 1
- 58 Merrimac St Unit 2-5
- 1 Hill St
- 1 Hill St Unit 1
- 166 Water St Unit B
- 164 Water St Unit A
- 41 Washington St Unit B
- 45 Boardman St Unit 1
- 126 Merrimac St Unit 47
- 23 Charter St Unit 6
- 23 Charter St Unit 5
- 23 Charter St Unit 3
- 23 Charter St Unit 2
- 23 Charter St Unit 1
- 23 Charter St Unit B
- 23 Charter St Unit 5 6
- 23 Charter St Unit 5,23
- 17 Charter St Unit 2
- 17 Charter St Unit 1
- 24 Essex St
- 25 Charter St Unit 5
- 25 Charter St Unit 4
- 25 Charter St Unit 3
- 25 Charter St Unit 2
- 25 Charter St Unit 1
- 25 Charter St Unit 1,1
- 28 Charter St
- 28 Charter St Unit 1
- 28 Charter St Unit 1, 1