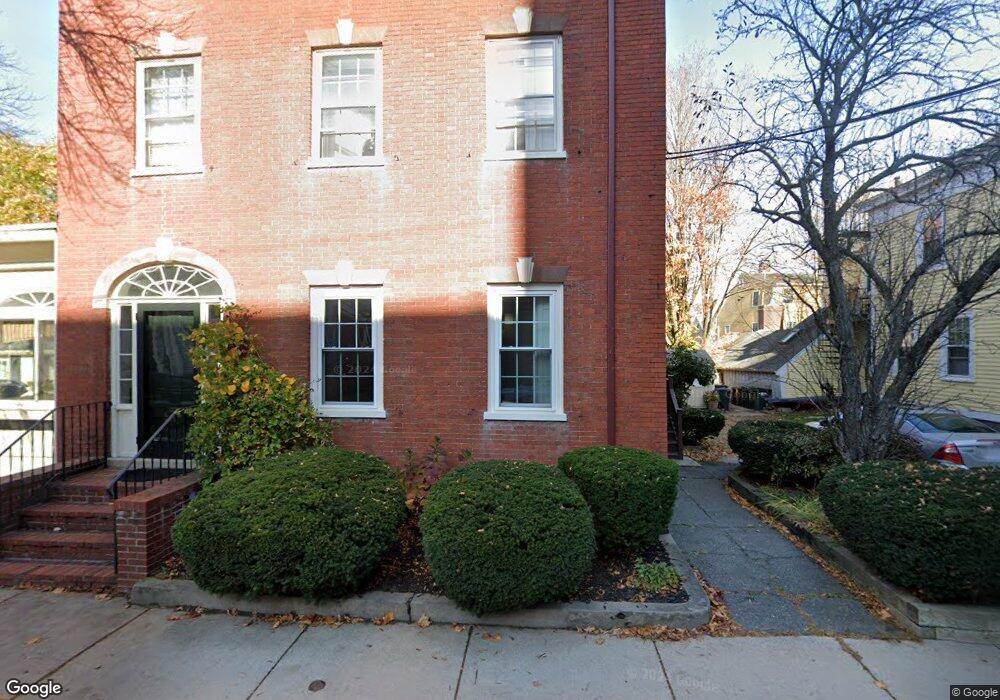
23 Charter St Unit 5 6 Newburyport, MA 01950
Estimated Value: $472,000 - $514,000
2
Beds
1
Bath
876
Sq Ft
$563/Sq Ft
Est. Value
About This Home
This home is located at 23 Charter St Unit 5 6, Newburyport, MA 01950 and is currently estimated at $493,338, approximately $563 per square foot. 23 Charter St Unit 5 6 is a home located in Essex County with nearby schools including Francis T. Bresnahan Elementary School, Edward G. Molin Elementary School, and Rupert A. Nock Middle School.
Ownership History
Date
Name
Owned For
Owner Type
Purchase Details
Closed on
Mar 12, 2020
Sold by
Us Bank Na Tr
Bought by
129 Spring Street Llc
Current Estimated Value
Purchase Details
Closed on
Jan 31, 2020
Sold by
Spitz Heidi
Bought by
Us Bank Na Tr
Purchase Details
Closed on
Mar 21, 2006
Sold by
Spitz Lenore S
Bought by
Spitz Lenore S
Purchase Details
Closed on
Jun 13, 2005
Sold by
Cunningham Mary C
Bought by
Spitz Lenore S
Purchase Details
Closed on
Mar 29, 2002
Sold by
Scola Sandra A
Bought by
Cunningham Mary C
Purchase Details
Closed on
May 15, 1998
Sold by
Neet Rt and Beckman William F
Bought by
Scola Sandra A
Purchase Details
Closed on
Aug 20, 1992
Sold by
Beckman William F
Bought by
Neet Rt
Create a Home Valuation Report for This Property
The Home Valuation Report is an in-depth analysis detailing your home's value as well as a comparison with similar homes in the area
Home Values in the Area
Average Home Value in this Area
Purchase History
| Date | Buyer | Sale Price | Title Company |
|---|---|---|---|
| 129 Spring Street Llc | $306,000 | None Available | |
| Us Bank Na Tr | $295,453 | None Available | |
| Spitz Lenore S | $284,000 | -- | |
| Spitz Lenore S | $284,000 | -- | |
| Cunningham Mary C | $224,900 | -- | |
| Scola Sandra A | $112,500 | -- | |
| Neet Rt | $40,000 | -- |
Source: Public Records
Mortgage History
| Date | Status | Borrower | Loan Amount |
|---|---|---|---|
| Previous Owner | Neet Rt | $250,000 | |
| Previous Owner | Neet Rt | $64,100 |
Source: Public Records
Tax History Compared to Growth
Tax History
| Year | Tax Paid | Tax Assessment Tax Assessment Total Assessment is a certain percentage of the fair market value that is determined by local assessors to be the total taxable value of land and additions on the property. | Land | Improvement |
|---|---|---|---|---|
| 2025 | $3,815 | $398,200 | $0 | $398,200 |
| 2024 | $3,724 | $373,500 | $0 | $373,500 |
| 2023 | $3,709 | $345,300 | $0 | $345,300 |
| 2022 | $3,621 | $301,500 | $0 | $301,500 |
| 2021 | $4,209 | $333,000 | $0 | $333,000 |
| 2020 | $4,191 | $326,400 | $0 | $326,400 |
| 2019 | $4,036 | $308,600 | $0 | $308,600 |
| 2018 | $3,970 | $299,400 | $0 | $299,400 |
| 2017 | $3,849 | $286,200 | $0 | $286,200 |
| 2016 | $3,621 | $270,400 | $0 | $270,400 |
| 2015 | $3,202 | $240,000 | $0 | $240,000 |
Source: Public Records
Map
Nearby Homes
- 11 Charter St
- 10 10th St
- 105 State St Unit 301
- 105 State St Unit 101
- 105 State St Unit 201
- 42 Federal St Unit B
- 30-32 Water St Unit 4
- 95 High St Unit 4
- 95 High St Unit 1
- 58 Lime St Unit 5
- 2 Court St Unit 4
- 57 Lime St Unit 1
- 58 Merrimac St Unit 2-5
- 1 Hill St
- 1 Hill St Unit 1
- 166 Water St Unit B
- 164 Water St Unit A
- 41 Washington St Unit B
- 45 Boardman St Unit 1
- 126 Merrimac St Unit 47
- 23 Charter St Unit 6
- 23 Charter St Unit 5
- 23 Charter St Unit 4
- 23 Charter St Unit 3
- 23 Charter St Unit 2
- 23 Charter St Unit 1
- 23 Charter St Unit B
- 23 Charter St Unit 5,23
- 17 Charter St Unit 2
- 17 Charter St Unit 1
- 24 Essex St
- 25 Charter St Unit 5
- 25 Charter St Unit 4
- 25 Charter St Unit 3
- 25 Charter St Unit 2
- 25 Charter St Unit 1
- 25 Charter St Unit 1,1
- 28 Charter St
- 28 Charter St Unit 1
- 28 Charter St Unit 1, 1