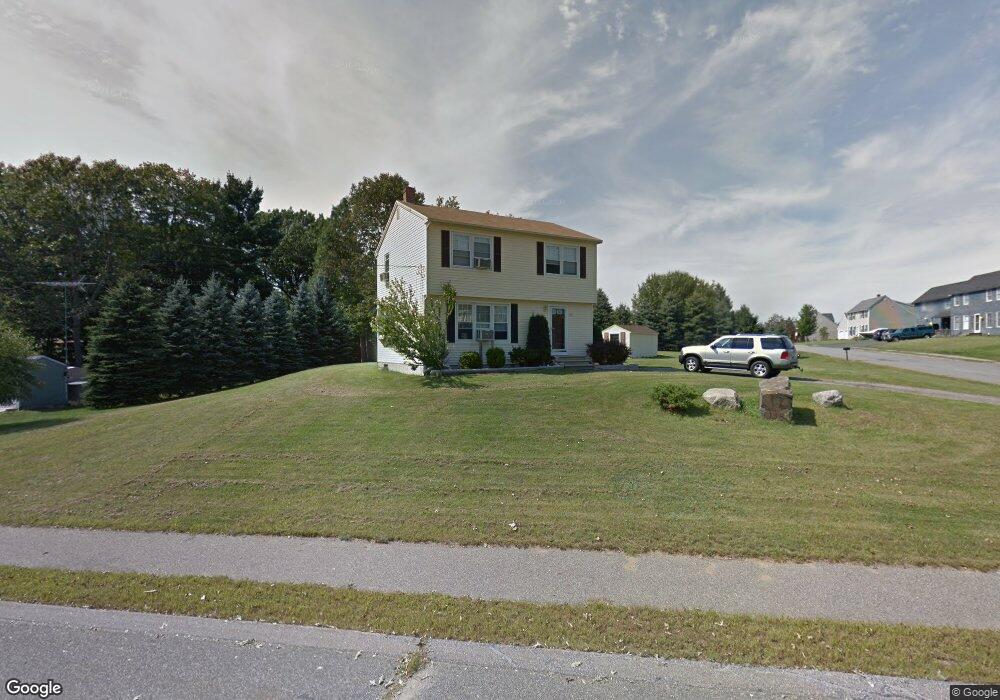
23 Chestnut Dr South Berwick, ME 03908
Estimated Value: $442,000 - $514,000
3
Beds
2
Baths
1,344
Sq Ft
$348/Sq Ft
Est. Value
About This Home
This home is located at 23 Chestnut Dr, South Berwick, ME 03908 and is currently estimated at $467,810, approximately $348 per square foot. 23 Chestnut Dr is a home located in York County with nearby schools including Marshwood High School, Berwick Academy, and Seacoast Christian School.
Ownership History
Date
Name
Owned For
Owner Type
Purchase Details
Closed on
Apr 19, 2021
Sold by
Hyder Mary A and Hyder Ward M
Bought by
Hyder-Ward Mary A
Current Estimated Value
Home Financials for this Owner
Home Financials are based on the most recent Mortgage that was taken out on this home.
Original Mortgage
$243,900
Interest Rate
2.9%
Mortgage Type
Purchase Money Mortgage
Create a Home Valuation Report for This Property
The Home Valuation Report is an in-depth analysis detailing your home's value as well as a comparison with similar homes in the area
Home Values in the Area
Average Home Value in this Area
Purchase History
| Date | Buyer | Sale Price | Title Company |
|---|---|---|---|
| Hyder-Ward Mary A | -- | None Available |
Source: Public Records
Mortgage History
| Date | Status | Borrower | Loan Amount |
|---|---|---|---|
| Previous Owner | Hyder-Ward Mary A | $243,900 |
Source: Public Records
Tax History
| Year | Tax Paid | Tax Assessment Tax Assessment Total Assessment is a certain percentage of the fair market value that is determined by local assessors to be the total taxable value of land and additions on the property. | Land | Improvement |
|---|---|---|---|---|
| 2024 | $4,641 | $345,800 | $156,600 | $189,200 |
| 2023 | $4,235 | $303,400 | $137,000 | $166,400 |
| 2022 | $3,823 | $262,900 | $130,500 | $132,400 |
| 2021 | $3,901 | $251,000 | $124,300 | $126,700 |
| 2020 | $3,995 | $228,300 | $110,000 | $118,300 |
| 2019 | $3,835 | $204,000 | $91,700 | $112,300 |
| 2018 | $3,572 | $199,400 | $91,300 | $108,100 |
| 2017 | $3,789 | $199,400 | $91,300 | $108,100 |
| 2016 | $3,649 | $199,400 | $91,300 | $108,100 |
| 2015 | $3,549 | $199,400 | $91,300 | $108,100 |
| 2014 | $3,529 | $199,400 | $91,300 | $108,100 |
Source: Public Records
Map
Nearby Homes
- 6 Drury Ln
- 47 Union St
- 10 Portland St
- 275 Main St
- 3 Legend Trail
- 14 Berwick Rd
- 38 Long Hall Dr
- 38 Wentworth St
- 0 Lindsay Ln
- 139 Wentworth Rd
- 296 Dow Hwy
- 3 Bhoireann Ln
- 4 Bhoireann Ln
- Lot 1 Brixham (Stonecrop Farm Lot 1) Rd
- 6 Friendship Ct
- Lot 4 Stonecrop Farm Ln
- 378 School St
- 249 Clement Rd
- 11 Country Club Estates Dr Unit 11
- 38 Wisteria Dr
Your Personal Tour Guide
Ask me questions while you tour the home.