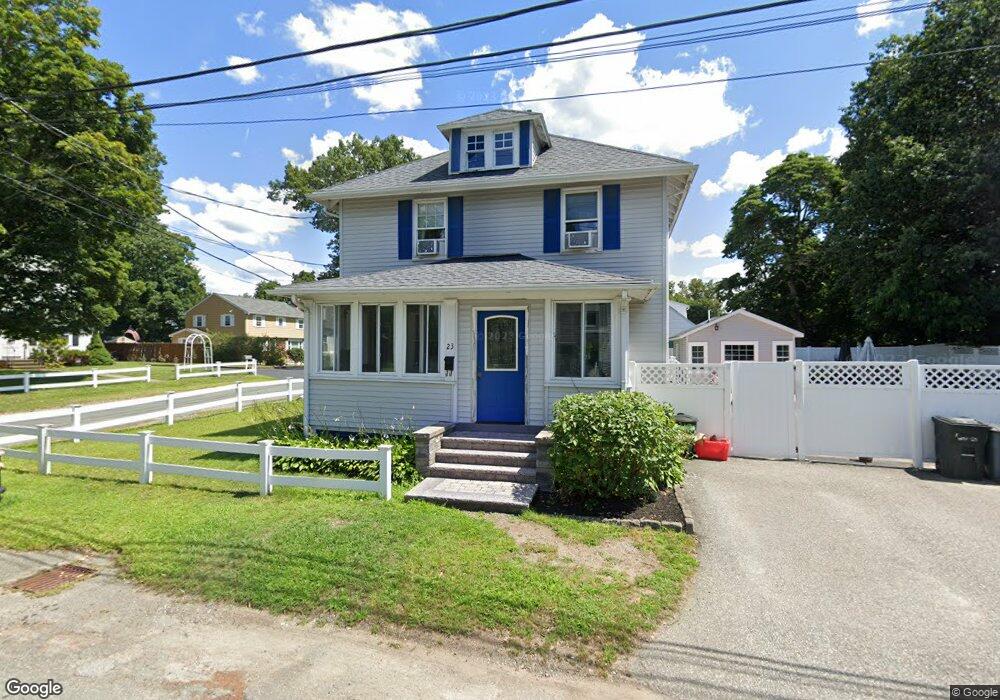
23 Chestnut Rd Reading, MA 01867
Estimated Value: $852,000 - $991,000
4
Beds
2
Baths
1,732
Sq Ft
$524/Sq Ft
Est. Value
About This Home
This home is located at 23 Chestnut Rd, Reading, MA 01867 and is currently estimated at $907,860, approximately $524 per square foot. 23 Chestnut Rd is a home located in Middlesex County with nearby schools including Birch Meadow Elementary School, Arthur W. Coolidge Middle School, and Reading Memorial High School.
Ownership History
Date
Name
Owned For
Owner Type
Purchase Details
Closed on
Jun 29, 2020
Sold by
Sarafian Nathan
Bought by
Nathan Sarafian Lt
Current Estimated Value
Purchase Details
Closed on
Aug 20, 2007
Sold by
Hughes Mary Jean
Bought by
Hughes Mary Jean and Gillen Patricia Ann
Purchase Details
Closed on
Sep 26, 1997
Sold by
Whittier Lawrence A and Whittier Dorothy J
Bought by
Hughes Mary J and Gillen Patricia A
Purchase Details
Closed on
Apr 9, 1993
Sold by
Conneely Patrick and Conneely Rosemarie
Bought by
Sarafian Nathan
Create a Home Valuation Report for This Property
The Home Valuation Report is an in-depth analysis detailing your home's value as well as a comparison with similar homes in the area
Home Values in the Area
Average Home Value in this Area
Purchase History
| Date | Buyer | Sale Price | Title Company |
|---|---|---|---|
| Nathan Sarafian Lt | -- | None Available | |
| Hughes Mary Jean | -- | -- | |
| Hughes Mary Jean | -- | -- | |
| Hughes Mary J | $221,500 | -- | |
| Sarafian Nathan | $158,500 | -- |
Source: Public Records
Mortgage History
| Date | Status | Borrower | Loan Amount |
|---|---|---|---|
| Previous Owner | Hughes Mary J | $150,000 | |
| Previous Owner | Hughes Mary J | $50,000 | |
| Previous Owner | Hughes Mary J | $15,000 |
Source: Public Records
Tax History
| Year | Tax Paid | Tax Assessment Tax Assessment Total Assessment is a certain percentage of the fair market value that is determined by local assessors to be the total taxable value of land and additions on the property. | Land | Improvement |
|---|---|---|---|---|
| 2025 | $8,771 | $770,100 | $417,200 | $352,900 |
| 2024 | $8,522 | $727,100 | $393,300 | $333,800 |
| 2023 | $8,677 | $689,200 | $374,600 | $314,600 |
| 2022 | $8,369 | $627,800 | $340,500 | $287,300 |
| 2021 | $8,039 | $582,100 | $317,800 | $264,300 |
| 2020 | $7,698 | $551,800 | $300,900 | $250,900 |
| 2019 | $6,252 | $526,100 | $286,600 | $239,500 |
| 2018 | $6,939 | $500,300 | $272,200 | $228,100 |
| 2017 | $6,725 | $479,300 | $260,500 | $218,800 |
| 2016 | $6,476 | $446,600 | $261,400 | $185,200 |
| 2015 | $6,259 | $425,800 | $248,900 | $176,900 |
| 2014 | $5,852 | $397,000 | $231,600 | $165,400 |
Source: Public Records
Map
Nearby Homes
- 35 Longfellow Rd
- 44 Grandview Rd
- 863 Main St
- 64 Longfellow Rd
- 89 Grand St
- 52 Sanborn St Unit 7
- 5 Washington St Unit D4
- 69 Ash St
- 115 Forest St
- 48 Village St Unit 1001
- 103 Orange St
- 41 Winter St
- 24 Smith Ave
- 43 Ashley Place
- 34 Plymouth Rd
- 150 Grove St
- 119 Van Norden Rd
- 100 Prescott St
- 43 Wakefield St
- 24 Minot St
Your Personal Tour Guide
Ask me questions while you tour the home.