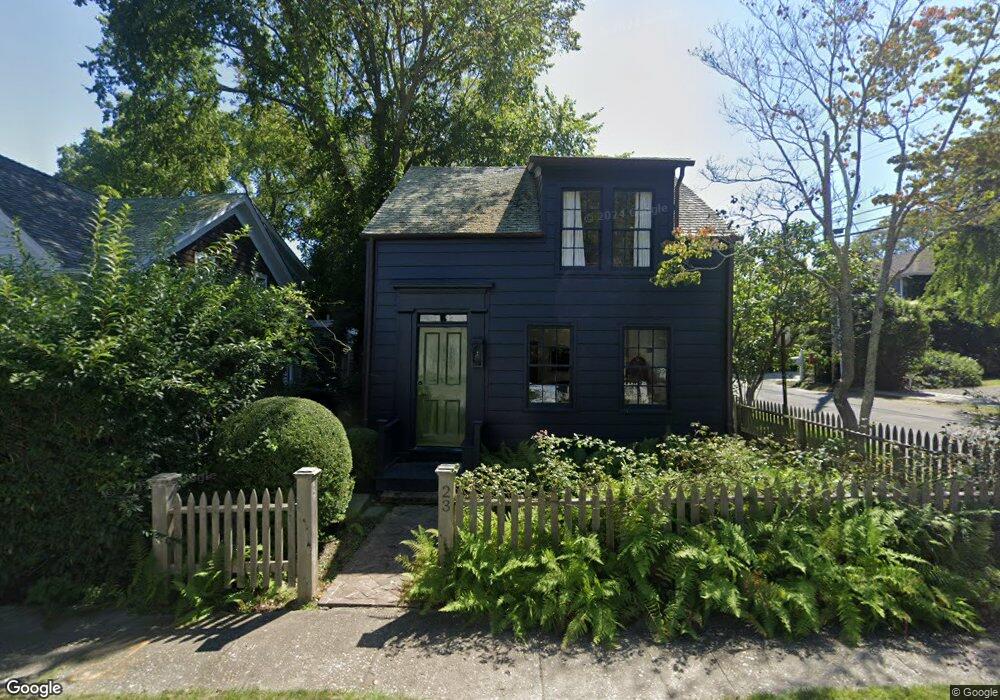
23 Concord St Sag Harbor, NY 11963
Estimated Value: $1,696,000 - $2,428,000
3
Beds
2
Baths
1,328
Sq Ft
$1,568/Sq Ft
Est. Value
About This Home
This home is located at 23 Concord St, Sag Harbor, NY 11963 and is currently estimated at $2,082,576, approximately $1,568 per square foot. 23 Concord St is a home located in Suffolk County with nearby schools including Sag Harbor Elementary School, Pierson Middle/High School, and Ross School.
Ownership History
Date
Name
Owned For
Owner Type
Purchase Details
Closed on
Sep 19, 2013
Sold by
Bibo James S
Bought by
Delavan Thomas
Current Estimated Value
Home Financials for this Owner
Home Financials are based on the most recent Mortgage that was taken out on this home.
Original Mortgage
$400,000
Outstanding Balance
$244,735
Interest Rate
0.33%
Mortgage Type
New Conventional
Estimated Equity
$1,837,841
Purchase Details
Closed on
Apr 8, 1996
Sold by
Finaly Adele R and Peter Craighead J
Bought by
Bibo James S
Create a Home Valuation Report for This Property
The Home Valuation Report is an in-depth analysis detailing your home's value as well as a comparison with similar homes in the area
Home Values in the Area
Average Home Value in this Area
Purchase History
| Date | Buyer | Sale Price | Title Company |
|---|---|---|---|
| Delavan Thomas | $750,000 | Chicago Title Insurance | |
| Bibo James S | $225,000 | The Title Guarantee Company |
Source: Public Records
Mortgage History
| Date | Status | Borrower | Loan Amount |
|---|---|---|---|
| Open | Delavan Thomas | $400,000 |
Source: Public Records
Tax History Compared to Growth
Tax History
| Year | Tax Paid | Tax Assessment Tax Assessment Total Assessment is a certain percentage of the fair market value that is determined by local assessors to be the total taxable value of land and additions on the property. | Land | Improvement |
|---|---|---|---|---|
| 2024 | $2,975 | $1,071,100 | $529,900 | $541,200 |
| 2023 | $2,946 | $1,071,100 | $529,900 | $541,200 |
| 2022 | $2,908 | $1,071,100 | $529,900 | $541,200 |
| 2021 | $2,926 | $1,071,100 | $529,900 | $541,200 |
| 2020 | $5,740 | $1,071,100 | $529,900 | $541,200 |
| 2019 | $8,572 | $0 | $0 | $0 |
| 2018 | -- | $805,700 | $397,400 | $408,300 |
| 2017 | $4,199 | $730,800 | $397,400 | $333,400 |
| 2016 | $4,367 | $730,800 | $397,400 | $333,400 |
| 2015 | -- | $730,800 | $397,400 | $333,400 |
| 2014 | -- | $513,500 | $397,400 | $116,100 |
Source: Public Records
Map
Nearby Homes