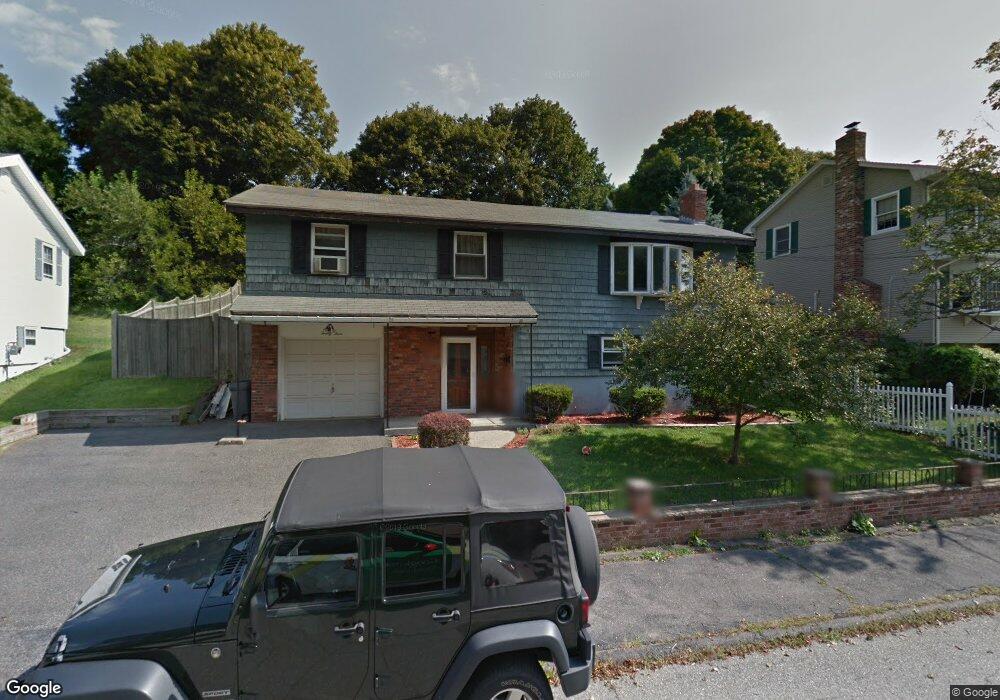
23 Crescent Dr Salem, MA 01970
Witchcraft Heights NeighborhoodEstimated Value: $682,135 - $732,000
3
Beds
2
Baths
1,626
Sq Ft
$431/Sq Ft
Est. Value
About This Home
This home is located at 23 Crescent Dr, Salem, MA 01970 and is currently estimated at $700,534, approximately $430 per square foot. 23 Crescent Dr is a home located in Essex County with nearby schools including Witchcraft Heights Elementary School, Horace Mann Laboratory, and Bates Elementary School.
Ownership History
Date
Name
Owned For
Owner Type
Purchase Details
Closed on
Mar 16, 2011
Sold by
Waters Michael D
Bought by
Salem City Of
Current Estimated Value
Purchase Details
Closed on
Dec 17, 1997
Sold by
Reina Dolores Ann Est
Bought by
Waters Micahel D and Waters Margaret
Create a Home Valuation Report for This Property
The Home Valuation Report is an in-depth analysis detailing your home's value as well as a comparison with similar homes in the area
Home Values in the Area
Average Home Value in this Area
Purchase History
| Date | Buyer | Sale Price | Title Company |
|---|---|---|---|
| Salem City Of | $2,475 | -- | |
| Waters Micahel D | $175,300 | -- |
Source: Public Records
Mortgage History
| Date | Status | Borrower | Loan Amount |
|---|---|---|---|
| Previous Owner | Waters Micahel D | $10,000 | |
| Previous Owner | Waters Micahel D | $294,833 |
Source: Public Records
Tax History
| Year | Tax Paid | Tax Assessment Tax Assessment Total Assessment is a certain percentage of the fair market value that is determined by local assessors to be the total taxable value of land and additions on the property. | Land | Improvement |
|---|---|---|---|---|
| 2025 | $6,743 | $594,600 | $222,300 | $372,300 |
| 2024 | $6,467 | $556,500 | $209,800 | $346,700 |
| 2023 | $6,290 | $502,800 | $191,000 | $311,800 |
| 2022 | $6,027 | $454,900 | $175,300 | $279,600 |
| 2021 | $5,742 | $416,100 | $162,800 | $253,300 |
| 2020 | $5,922 | $409,800 | $159,700 | $250,100 |
| 2019 | $5,894 | $390,300 | $150,300 | $240,000 |
| 2018 | $5,515 | $358,600 | $140,300 | $218,300 |
| 2017 | $5,281 | $333,000 | $131,500 | $201,500 |
| 2016 | $5,218 | $333,000 | $131,500 | $201,500 |
| 2015 | $4,933 | $300,600 | $115,800 | $184,800 |
Source: Public Records
Map
Nearby Homes
Your Personal Tour Guide
Ask me questions while you tour the home.