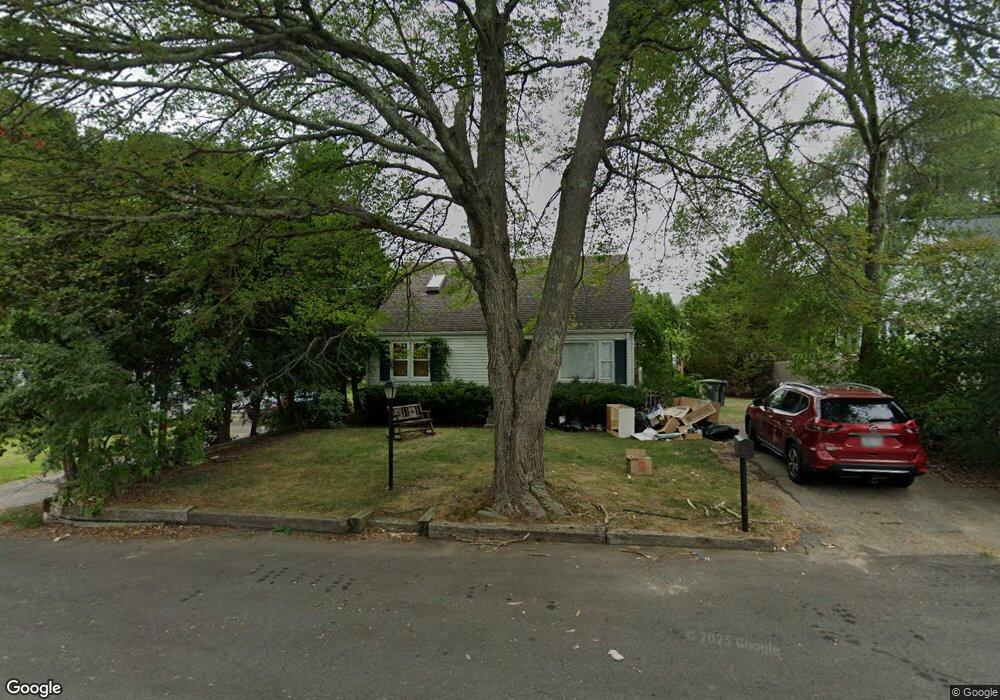
23 Dexter St Coventry, RI 02816
Estimated Value: $351,000 - $396,000
3
Beds
2
Baths
1,440
Sq Ft
$260/Sq Ft
Est. Value
About This Home
This home is located at 23 Dexter St, Coventry, RI 02816 and is currently estimated at $374,069, approximately $259 per square foot. 23 Dexter St is a home located in Kent County with nearby schools including Alan Shawn Feinstein Ms Of Cov, Coventry High School, and Father John V. Doyle School.
Ownership History
Date
Name
Owned For
Owner Type
Purchase Details
Closed on
Jul 14, 2011
Sold by
Burke Robert T and Burke Kathleen A
Bought by
Ronci Cheryl A
Current Estimated Value
Home Financials for this Owner
Home Financials are based on the most recent Mortgage that was taken out on this home.
Original Mortgage
$136,451
Outstanding Balance
$92,822
Interest Rate
4.58%
Mortgage Type
Purchase Money Mortgage
Estimated Equity
$281,247
Purchase Details
Closed on
Jun 29, 2007
Sold by
Eyre Wendy D
Bought by
Burke Kathleen M and Burke Robert T
Home Financials for this Owner
Home Financials are based on the most recent Mortgage that was taken out on this home.
Original Mortgage
$196,000
Interest Rate
6.8%
Mortgage Type
Adjustable Rate Mortgage/ARM
Purchase Details
Closed on
May 31, 1996
Sold by
Iadeluca Matthew
Bought by
Eyre Wendy D
Create a Home Valuation Report for This Property
The Home Valuation Report is an in-depth analysis detailing your home's value as well as a comparison with similar homes in the area
Purchase History
| Date | Buyer | Sale Price | Title Company |
|---|---|---|---|
| Ronci Cheryl A | $140,000 | -- | |
| Burke Kathleen M | $245,000 | -- | |
| Eyre Wendy D | $100,000 | -- |
Source: Public Records
Mortgage History
| Date | Status | Borrower | Loan Amount |
|---|---|---|---|
| Open | Eyre Wendy D | $136,451 | |
| Previous Owner | Eyre Wendy D | $196,000 | |
| Previous Owner | Eyre Wendy D | $49,000 | |
| Previous Owner | Eyre Wendy D | $16,000 |
Source: Public Records
Tax History
| Year | Tax Paid | Tax Assessment Tax Assessment Total Assessment is a certain percentage of the fair market value that is determined by local assessors to be the total taxable value of land and additions on the property. | Land | Improvement |
|---|---|---|---|---|
| 2025 | $3,947 | $245,300 | $86,300 | $159,000 |
| 2024 | $3,886 | $245,300 | $86,300 | $159,000 |
| 2023 | $3,760 | $245,300 | $86,300 | $159,000 |
| 2022 | $3,634 | $185,700 | $83,000 | $102,700 |
| 2021 | $3,603 | $185,700 | $83,000 | $102,700 |
| 2020 | $4,130 | $185,700 | $83,000 | $102,700 |
| 2019 | $3,581 | $161,000 | $69,600 | $91,400 |
| 2018 | $3,479 | $161,000 | $69,600 | $91,400 |
| 2017 | $3,378 | $161,000 | $69,600 | $91,400 |
| 2016 | $3,085 | $144,100 | $58,000 | $86,100 |
| 2015 | $3,002 | $144,100 | $58,000 | $86,100 |
| 2014 | $2,939 | $144,100 | $58,000 | $86,100 |
| 2013 | $2,971 | $159,200 | $73,400 | $85,800 |
Source: Public Records
Map
Nearby Homes
- 21 Darton St
- 55 Columbia Ave
- 27 Matteson St
- 22 Colorado St
- 27 Mead St
- 39 Mohawk St
- 91 Windsor Park Dr
- 82 Wood St
- 45 Pine Ave Unit 36
- 37 Holden St
- 31 Anthony St Unit 33
- 33-35 Holden St
- 33 Holden St Unit 35
- 57 Twin Lakes Ave
- 275 E Shore Dr
- 251 E Shore Dr
- 4 Pearl St
- 10 Colonial Rd
- 18 S Main St
- 69 Station St
Your Personal Tour Guide
Ask me questions while you tour the home.