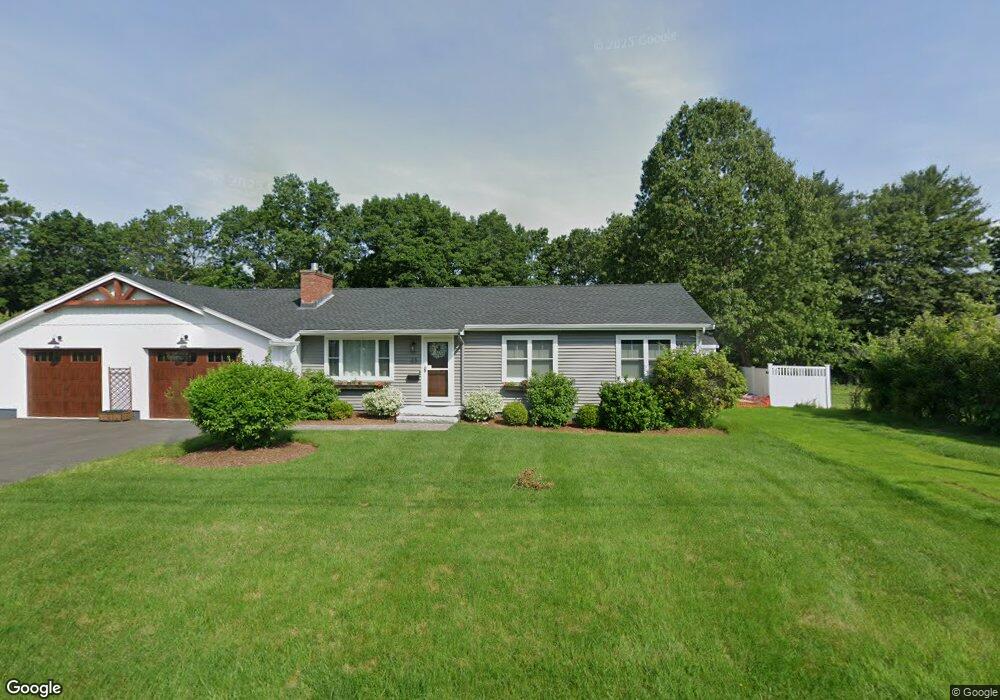
23 Drexel Dr North Chelmsford, MA 01863
West Chelmsford NeighborhoodEstimated Value: $567,000 - $709,000
3
Beds
1
Bath
1,032
Sq Ft
$603/Sq Ft
Est. Value
About This Home
This home is located at 23 Drexel Dr, North Chelmsford, MA 01863 and is currently estimated at $622,690, approximately $603 per square foot. 23 Drexel Dr is a home located in Middlesex County with nearby schools including Parker Middle School, Charles D. Harrington Elementary School, and Chelmsford High School.
Ownership History
Date
Name
Owned For
Owner Type
Purchase Details
Closed on
Feb 23, 2018
Sold by
Cole Irene C
Bought by
Foster Todd E and Foster Stacey E
Current Estimated Value
Home Financials for this Owner
Home Financials are based on the most recent Mortgage that was taken out on this home.
Original Mortgage
$248,000
Outstanding Balance
$210,034
Interest Rate
3.99%
Mortgage Type
New Conventional
Estimated Equity
$412,656
Purchase Details
Closed on
Jun 15, 1981
Bought by
Cole Irene C
Create a Home Valuation Report for This Property
The Home Valuation Report is an in-depth analysis detailing your home's value as well as a comparison with similar homes in the area
Home Values in the Area
Average Home Value in this Area
Purchase History
| Date | Buyer | Sale Price | Title Company |
|---|---|---|---|
| Foster Todd E | $310,000 | -- | |
| Cole Irene C | $65,900 | -- |
Source: Public Records
Mortgage History
| Date | Status | Borrower | Loan Amount |
|---|---|---|---|
| Open | Foster Todd E | $248,000 | |
| Closed | Cole Irene C | $248,000 |
Source: Public Records
Tax History Compared to Growth
Tax History
| Year | Tax Paid | Tax Assessment Tax Assessment Total Assessment is a certain percentage of the fair market value that is determined by local assessors to be the total taxable value of land and additions on the property. | Land | Improvement |
|---|---|---|---|---|
| 2025 | $7,081 | $509,400 | $285,900 | $223,500 |
| 2024 | $6,370 | $467,700 | $285,900 | $181,800 |
| 2023 | $6,224 | $433,100 | $307,500 | $125,600 |
| 2022 | $5,999 | $380,400 | $264,000 | $116,400 |
| 2021 | $5,377 | $341,600 | $242,200 | $99,400 |
| 2020 | $5,271 | $320,400 | $207,600 | $112,800 |
| 2019 | $5,914 | $361,700 | $205,600 | $156,100 |
| 2018 | $5,815 | $323,800 | $185,200 | $138,600 |
| 2017 | $5,424 | $302,700 | $173,500 | $129,200 |
| 2016 | $5,295 | $293,700 | $177,400 | $116,300 |
| 2015 | $5,165 | $276,200 | $161,300 | $114,900 |
| 2014 | $4,984 | $262,600 | $152,500 | $110,100 |
Source: Public Records
Map
Nearby Homes