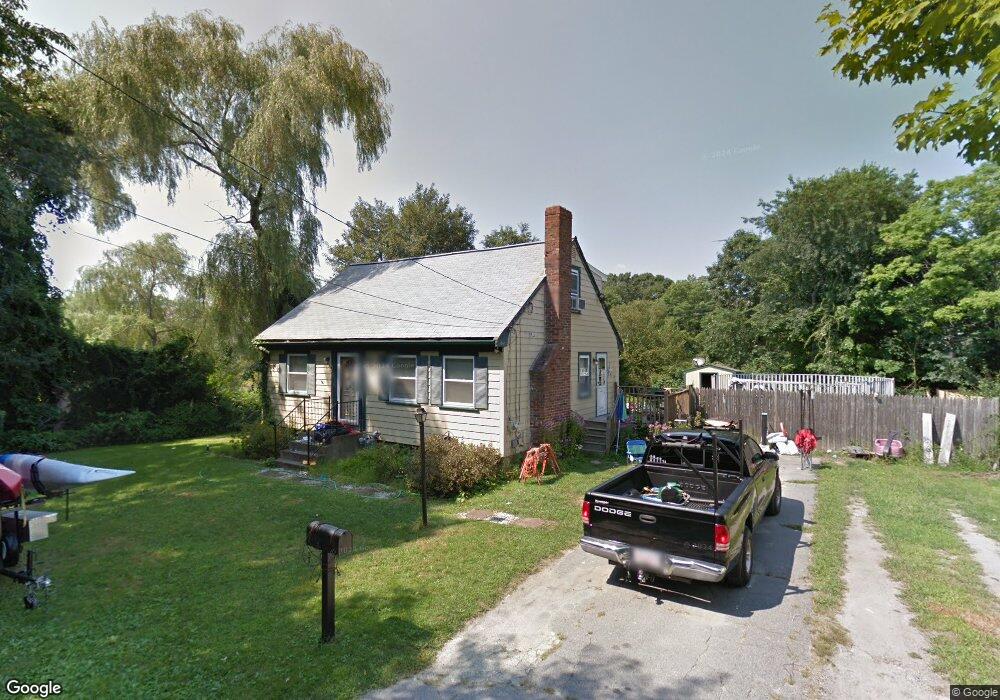
23 Dunbar Rd South Weymouth, MA 02190
South Weymouth NeighborhoodEstimated Value: $602,000 - $635,000
4
Beds
1
Bath
1,260
Sq Ft
$490/Sq Ft
Est. Value
About This Home
This home is located at 23 Dunbar Rd, South Weymouth, MA 02190 and is currently estimated at $616,951, approximately $489 per square foot. 23 Dunbar Rd is a home located in Norfolk County with nearby schools including Thomas V Nash, Abigail Adams Middle School, and Weymouth Middle School Chapman.
Ownership History
Date
Name
Owned For
Owner Type
Purchase Details
Closed on
Dec 30, 1999
Sold by
Okeefe Anna E
Bought by
Okeefe Maureen A
Current Estimated Value
Home Financials for this Owner
Home Financials are based on the most recent Mortgage that was taken out on this home.
Original Mortgage
$63,000
Outstanding Balance
$19,821
Interest Rate
7.71%
Mortgage Type
Purchase Money Mortgage
Estimated Equity
$597,130
Create a Home Valuation Report for This Property
The Home Valuation Report is an in-depth analysis detailing your home's value as well as a comparison with similar homes in the area
Home Values in the Area
Average Home Value in this Area
Purchase History
| Date | Buyer | Sale Price | Title Company |
|---|---|---|---|
| Okeefe Maureen A | $70,000 | -- |
Source: Public Records
Mortgage History
| Date | Status | Borrower | Loan Amount |
|---|---|---|---|
| Open | Okeefe Maureen A | $63,000 | |
| Previous Owner | Okeefe Maureen A | $38,000 | |
| Previous Owner | Okeefe Maureen A | $32,000 | |
| Previous Owner | Okeefe Maureen A | $16,856 |
Source: Public Records
Tax History Compared to Growth
Tax History
| Year | Tax Paid | Tax Assessment Tax Assessment Total Assessment is a certain percentage of the fair market value that is determined by local assessors to be the total taxable value of land and additions on the property. | Land | Improvement |
|---|---|---|---|---|
| 2025 | $5,168 | $511,700 | $220,400 | $291,300 |
| 2024 | $5,006 | $487,400 | $209,900 | $277,500 |
| 2023 | $4,811 | $460,400 | $194,400 | $266,000 |
| 2022 | $4,693 | $409,500 | $180,000 | $229,500 |
| 2021 | $4,321 | $368,100 | $180,000 | $188,100 |
| 2020 | $4,087 | $342,900 | $180,000 | $162,900 |
| 2019 | $4,018 | $331,500 | $173,100 | $158,400 |
| 2018 | $3,894 | $311,500 | $164,800 | $146,700 |
| 2017 | $3,856 | $301,000 | $157,000 | $144,000 |
| 2016 | $3,706 | $289,500 | $151,000 | $138,500 |
| 2015 | $3,486 | $270,200 | $144,100 | $126,100 |
| 2014 | $3,276 | $246,300 | $134,100 | $112,200 |
Source: Public Records
Map
Nearby Homes
- 2 Mitchell Ln Unit B
- 27 Park Ave
- 261 Pleasant St Unit 5
- 45 Union St
- 92 Mercury St
- 24 Fisher Rd
- 120 Burkhall St Unit K
- 16 Jay Rd
- 110 Burkhall St Unit H
- 376 Pleasant St
- 308 Forest St
- 200 Burkhall St Unit 803
- 200 Burkhall St Unit 102
- 262 West St
- 255 West St
- 120 Randolph St
- 18 Fountain Ln Unit 2
- 191 Tall Oaks Dr Unit C
- 25 Wales Ave
- 50 Hollis St
- 15 Dunbar Rd
- 14 Dunbar Rd
- 723 Main St
- 24 Bayley Terrace
- 729 Main St
- 719 Main St Unit 1
- 715 Main St Unit 3
- 715 Main St Unit 1
- 715 Main St
- 715 Main St Unit 2
- 733 Main St
- 717 Main St
- 717 Main St Unit 1 R
- 717 Main St Unit 2
- 717 Main St Unit 1
- 717 Main St Unit 3
- 741 Main St
- 1153 Front St
- 29 Park Ave W
- 720 Main St Unit 21