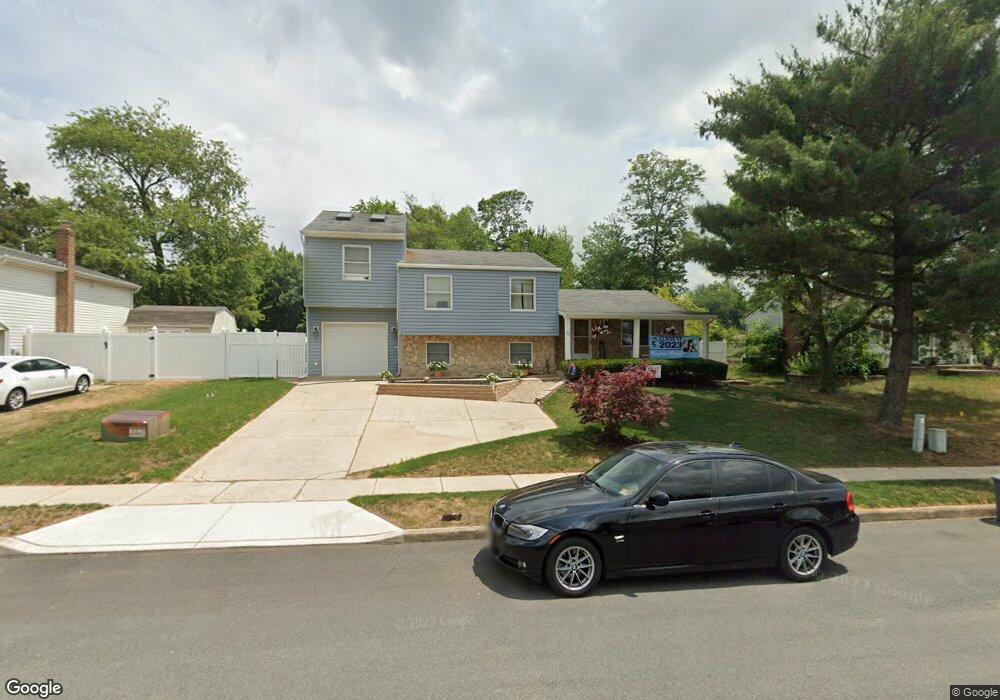
23 Dunlin Way Sicklerville, NJ 08081
Erial NeighborhoodEstimated Value: $334,754 - $407,000
--
Bed
--
Bath
1,766
Sq Ft
$218/Sq Ft
Est. Value
About This Home
This home is located at 23 Dunlin Way, Sicklerville, NJ 08081 and is currently estimated at $384,939, approximately $217 per square foot. 23 Dunlin Way is a home located in Camden County with nearby schools including James W. Lilley Elementary School, Timber Creek High School, and Erial Community Church Christian School.
Ownership History
Date
Name
Owned For
Owner Type
Purchase Details
Closed on
Oct 4, 2016
Sold by
Fortune Joseph A and Fortune Donna A
Bought by
Fortune Joseph R
Current Estimated Value
Home Financials for this Owner
Home Financials are based on the most recent Mortgage that was taken out on this home.
Original Mortgage
$178,600
Outstanding Balance
$143,045
Interest Rate
3.43%
Mortgage Type
New Conventional
Estimated Equity
$241,894
Purchase Details
Closed on
May 27, 1983
Bought by
Fortune Joseph A and Fortune Donna A
Create a Home Valuation Report for This Property
The Home Valuation Report is an in-depth analysis detailing your home's value as well as a comparison with similar homes in the area
Home Values in the Area
Average Home Value in this Area
Purchase History
| Date | Buyer | Sale Price | Title Company |
|---|---|---|---|
| Fortune Joseph R | $188,000 | Paradigm Title Group Llc | |
| Fortune Joseph A | $60,100 | -- |
Source: Public Records
Mortgage History
| Date | Status | Borrower | Loan Amount |
|---|---|---|---|
| Open | Fortune Joseph R | $178,600 |
Source: Public Records
Tax History Compared to Growth
Tax History
| Year | Tax Paid | Tax Assessment Tax Assessment Total Assessment is a certain percentage of the fair market value that is determined by local assessors to be the total taxable value of land and additions on the property. | Land | Improvement |
|---|---|---|---|---|
| 2025 | $8,869 | $204,400 | $65,000 | $139,400 |
| 2024 | $8,618 | $204,400 | $65,000 | $139,400 |
| 2023 | $8,618 | $204,400 | $65,000 | $139,400 |
| 2022 | $8,568 | $204,400 | $65,000 | $139,400 |
| 2021 | $8,391 | $204,400 | $65,000 | $139,400 |
| 2020 | $8,393 | $204,400 | $65,000 | $139,400 |
| 2019 | $8,211 | $204,400 | $65,000 | $139,400 |
| 2018 | $8,176 | $204,400 | $65,000 | $139,400 |
| 2017 | $7,914 | $204,400 | $65,000 | $139,400 |
| 2016 | $8,028 | $212,100 | $65,000 | $147,100 |
| 2015 | $7,449 | $212,100 | $65,000 | $147,100 |
| 2014 | $7,424 | $212,100 | $65,000 | $147,100 |
Source: Public Records
Map
Nearby Homes
- 50 E Meadowbrook Cir
- Fairfield Plan at Emerson Square
- 102 Old School House Rd
- 12 Handbell Ln
- Richmond Plan at Emerson Square
- 110 Old School House Rd
- 9 Pine Glen Dr
- 3 Balsley Ct
- 111 Presidential Dr
- 41 Noble Rd
- 34 Vance Ave
- Chase Grande Plan at Chase Pointe
- 1721 Sicklerville Rd
- 24 Whalen Ave
- 14 Berkshire Rd
- 3 Wilshire Rd
- 3 Wilshire Rd
- 155 Hampshire Rd
- 105 Berkshire Rd
- 10 Waterview Dr