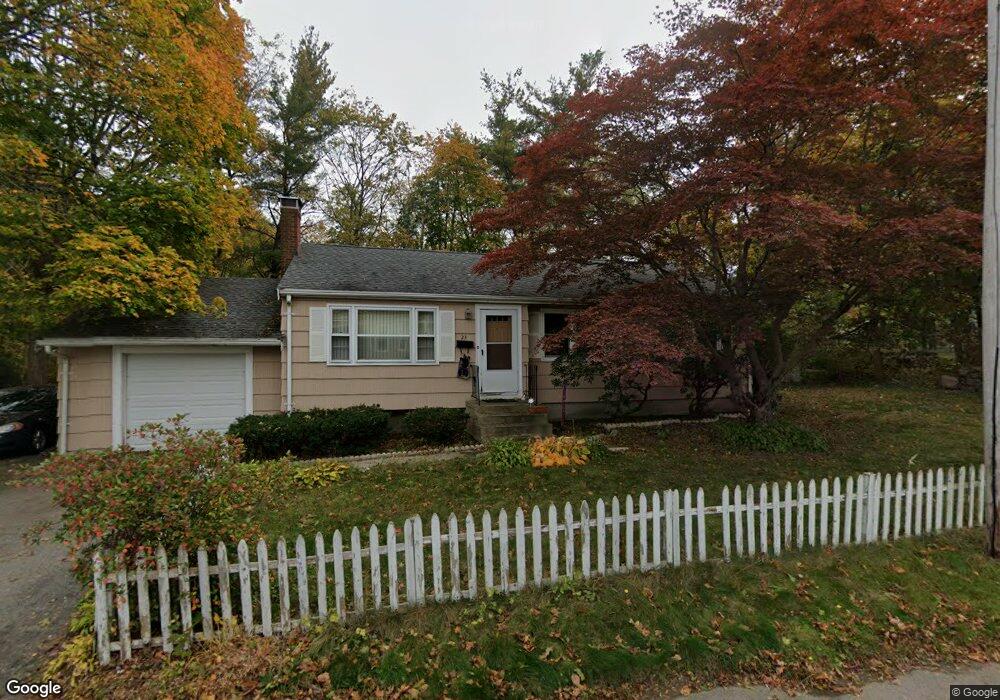
23 Dupont Cir Brockton, MA 02302
Estimated Value: $444,000 - $469,000
3
Beds
1
Bath
1,008
Sq Ft
$448/Sq Ft
Est. Value
About This Home
This home is located at 23 Dupont Cir, Brockton, MA 02302 and is currently estimated at $451,620, approximately $448 per square foot. 23 Dupont Cir is a home located in Plymouth County with nearby schools including Brookfield Elementary School, Downey Elementary School, and Ashfield Middle School.
Ownership History
Date
Name
Owned For
Owner Type
Purchase Details
Closed on
Oct 16, 2009
Sold by
23 Dupont Circle Rt
Bought by
Delfraino Anthony and Lowry Barbara
Current Estimated Value
Home Financials for this Owner
Home Financials are based on the most recent Mortgage that was taken out on this home.
Original Mortgage
$176,800
Outstanding Balance
$115,801
Interest Rate
5.14%
Mortgage Type
Purchase Money Mortgage
Estimated Equity
$335,819
Purchase Details
Closed on
Apr 13, 2009
Sold by
Jp Morgan Chase Bk
Bought by
23 Dupont Circle Rt
Purchase Details
Closed on
Apr 3, 2009
Sold by
Donachie Lorraine M
Bought by
Jp Morgan Chase Bk
Purchase Details
Closed on
Oct 13, 2004
Sold by
Garner Charles and Garner Joyce E
Bought by
Donachie Lorraine M
Home Financials for this Owner
Home Financials are based on the most recent Mortgage that was taken out on this home.
Original Mortgage
$223,920
Interest Rate
5.8%
Mortgage Type
Purchase Money Mortgage
Purchase Details
Closed on
Jul 25, 2003
Sold by
Garner Andrew A
Bought by
Garner Charles and Garner Joyce E
Create a Home Valuation Report for This Property
The Home Valuation Report is an in-depth analysis detailing your home's value as well as a comparison with similar homes in the area
Home Values in the Area
Average Home Value in this Area
Purchase History
| Date | Buyer | Sale Price | Title Company |
|---|---|---|---|
| Delfraino Anthony | $221,000 | -- | |
| 23 Dupont Circle Rt | $114,084 | -- | |
| Jp Morgan Chase Bk | $170,000 | -- | |
| Donachie Lorraine M | $279,900 | -- | |
| Garner Charles | -- | -- |
Source: Public Records
Mortgage History
| Date | Status | Borrower | Loan Amount |
|---|---|---|---|
| Open | Garner Charles | $176,800 | |
| Previous Owner | Garner Charles | $35,196 | |
| Previous Owner | Garner Charles | $223,920 |
Source: Public Records
Tax History Compared to Growth
Tax History
| Year | Tax Paid | Tax Assessment Tax Assessment Total Assessment is a certain percentage of the fair market value that is determined by local assessors to be the total taxable value of land and additions on the property. | Land | Improvement |
|---|---|---|---|---|
| 2025 | $4,815 | $397,600 | $160,800 | $236,800 |
| 2024 | $4,725 | $393,100 | $160,800 | $232,300 |
| 2023 | $4,496 | $346,400 | $111,100 | $235,300 |
| 2022 | $4,409 | $315,600 | $101,000 | $214,600 |
| 2021 | $4,096 | $282,500 | $93,900 | $188,600 |
| 2020 | $4,153 | $274,100 | $82,300 | $191,800 |
| 2019 | $4,143 | $266,600 | $78,700 | $187,900 |
| 2018 | $3,543 | $220,600 | $78,700 | $141,900 |
| 2017 | $3,305 | $205,300 | $78,700 | $126,600 |
| 2016 | $3,350 | $193,000 | $75,000 | $118,000 |
| 2015 | $3,129 | $172,400 | $75,000 | $97,400 |
| 2014 | $3,069 | $169,300 | $75,000 | $94,300 |
Source: Public Records
Map
Nearby Homes