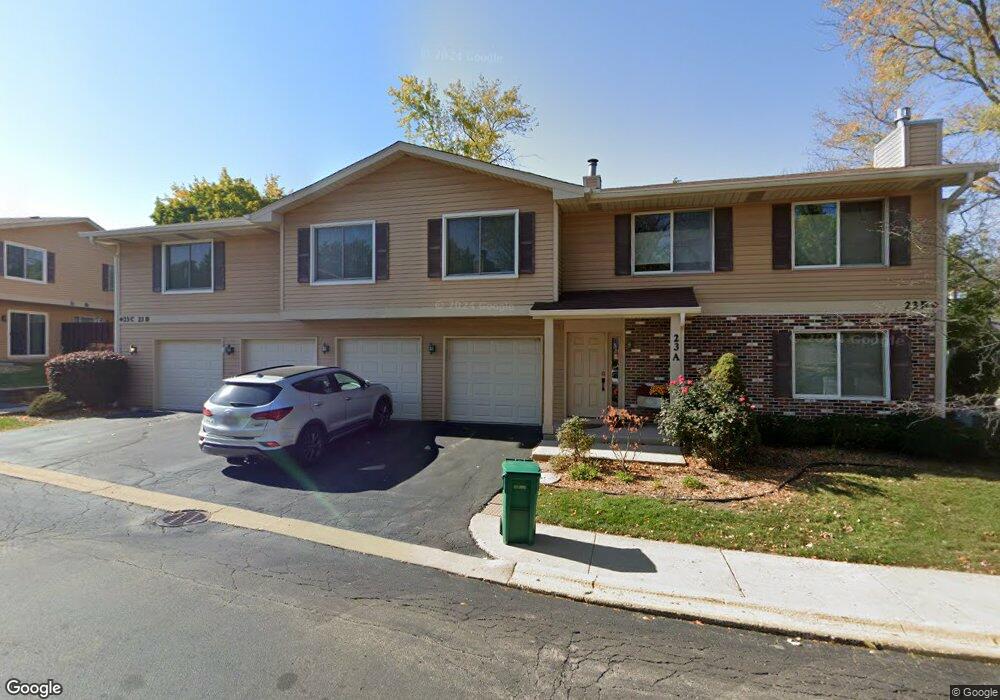
23 E Hickory St Unit 801 Lombard, IL 60148
North Lombard NeighborhoodEstimated Value: $257,000 - $289,000
--
Bed
--
Bath
1,165
Sq Ft
$236/Sq Ft
Est. Value
About This Home
This home is located at 23 E Hickory St Unit 801, Lombard, IL 60148 and is currently estimated at $275,161, approximately $236 per square foot. 23 E Hickory St Unit 801 is a home located in DuPage County with nearby schools including Madison Elementary School, Wm Hammerschmidt Elementary School, and Pleasant Lane Elementary School.
Ownership History
Date
Name
Owned For
Owner Type
Purchase Details
Closed on
Mar 15, 2017
Sold by
Sutor Scott and Johnson Kirsten K
Bought by
Porter Adrienne
Current Estimated Value
Home Financials for this Owner
Home Financials are based on the most recent Mortgage that was taken out on this home.
Original Mortgage
$158,650
Outstanding Balance
$132,750
Interest Rate
4.5%
Mortgage Type
New Conventional
Estimated Equity
$142,411
Purchase Details
Closed on
Oct 25, 2012
Sold by
Johnson Michael S and Johnson Kristen K
Bought by
Sutor Scott and Johnson Kristen K
Purchase Details
Closed on
Dec 13, 2011
Sold by
Chicago Title Land Trust Company
Bought by
Johnson Michael S and Johnson Kirsten K
Purchase Details
Closed on
Oct 28, 2011
Sold by
Keil Charles A
Bought by
Chicago Title Land Trust Company and Trust #8002358201
Purchase Details
Closed on
Dec 15, 2003
Sold by
Adamek Charles A
Bought by
Keil Charles A
Create a Home Valuation Report for This Property
The Home Valuation Report is an in-depth analysis detailing your home's value as well as a comparison with similar homes in the area
Home Values in the Area
Average Home Value in this Area
Purchase History
| Date | Buyer | Sale Price | Title Company |
|---|---|---|---|
| Porter Adrienne | $172,000 | Attorneys Title Guaranty Fun | |
| Sutor Scott | -- | None Available | |
| Johnson Michael S | $72,000 | Chicago Title Land Trust Co | |
| Chicago Title Land Trust Company | $30,000 | Chicago Title Land Trust Co | |
| Keil Charles A | -- | Ctic |
Source: Public Records
Mortgage History
| Date | Status | Borrower | Loan Amount |
|---|---|---|---|
| Open | Porter Adrienne | $158,650 |
Source: Public Records
Tax History Compared to Growth
Tax History
| Year | Tax Paid | Tax Assessment Tax Assessment Total Assessment is a certain percentage of the fair market value that is determined by local assessors to be the total taxable value of land and additions on the property. | Land | Improvement |
|---|---|---|---|---|
| 2024 | $5,275 | $75,892 | $7,591 | $68,301 |
| 2023 | $5,000 | $70,180 | $7,020 | $63,160 |
| 2022 | $4,662 | $64,420 | $6,440 | $57,980 |
| 2021 | $4,511 | $62,820 | $6,280 | $56,540 |
| 2020 | $4,412 | $61,440 | $6,140 | $55,300 |
| 2019 | $4,182 | $58,420 | $5,840 | $52,580 |
| 2018 | $3,813 | $51,940 | $5,240 | $46,700 |
| 2017 | $3,419 | $46,250 | $4,660 | $41,590 |
| 2016 | $3,309 | $43,570 | $4,390 | $39,180 |
| 2015 | $3,107 | $40,590 | $4,090 | $36,500 |
| 2014 | $3,666 | $45,620 | $4,590 | $41,030 |
| 2013 | $3,613 | $46,260 | $4,650 | $41,610 |
Source: Public Records
Map
Nearby Homes
- 185 W Hickory Rd
- 250 St Regis
- 465 S Elizabeth St
- 610 Hammerschmidt Ave
- 313 S Lombard Ave
- 328 S Grace St
- 635 S Charlotte St
- 337 S Brewster Ave
- 407 S Brewster Ave
- 107 S Charlotte St
- 6 W Harding Rd
- 1 S Lincoln Ave Unit 301
- 570 S Fairfield Ave
- 33 N Main St Unit 11A
- 528 E Washington Blvd
- 105 E Grove St
- 49 Orchard Terrace Unit 1
- 406 S Edgewood Ave
- 826 S Main St
- 78 N Elizabeth St
- 27 E Hickory St Unit D
- 27 E Hickory St Unit 4D
- 37 E Hickory St Unit D
- 33 E Hickory St Unit D
- 35 E Hickory St Unit 203
- 29 E Hickory St Unit 504
- 23 E Hickory St Unit B
- 35 E Hickory St Unit 204
- 35 E Hickory St Unit 201
- 27 E Hickory St Unit 27B
- 35 E Hickory St Unit 202
- 33 E Hickory St Unit 301
- 37 E Hickory St Unit A
- 33 E Hickory St Unit 302
- 37 E Hickory St Unit C
- 37 E Hickory St Unit 102
- 23 E Hickory St Unit 804
- 23 E Hickory St Unit C
- 27 E Hickory St Unit 601
- 29 E Hickory St Unit 503