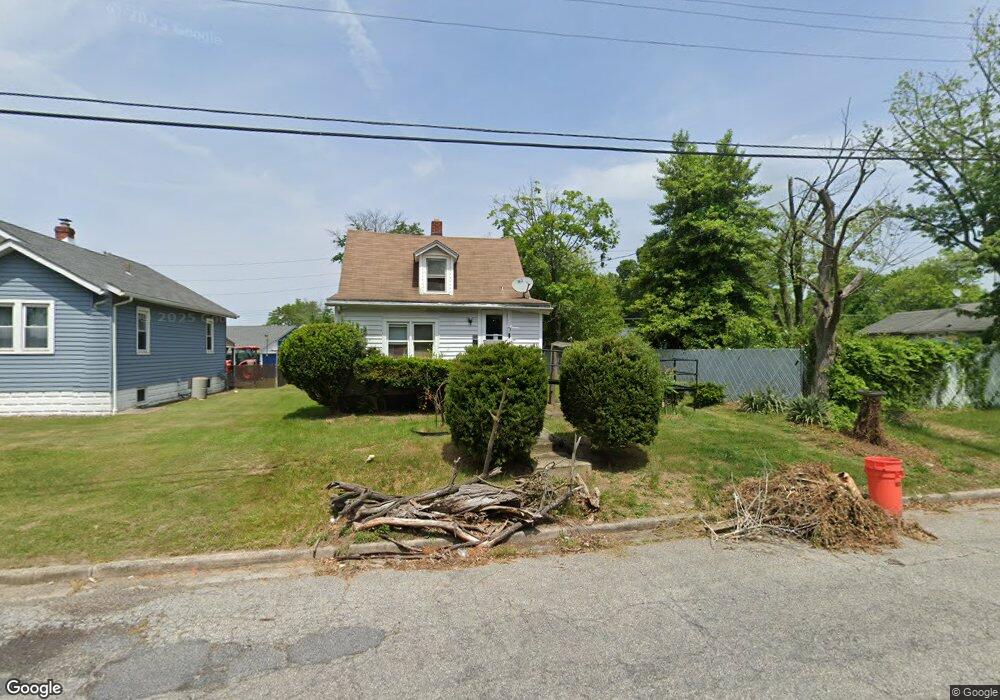
23 E Union St Penns Grove, NJ 08069
Estimated Value: $138,150 - $175,000
Studio
--
Bath
1,004
Sq Ft
$154/Sq Ft
Est. Value
About This Home
This home is located at 23 E Union St, Penns Grove, NJ 08069 and is currently estimated at $154,288, approximately $153 per square foot. 23 E Union St is a home located in Salem County with nearby schools including Lafayette-Pershing Elementary School, Field Street Elementary School, and Paul W. Carleton Elementary School.
Ownership History
Date
Name
Owned For
Owner Type
Purchase Details
Closed on
Sep 10, 2004
Sold by
Godsmark Charles
Bought by
Witherspoon Charles H
Current Estimated Value
Home Financials for this Owner
Home Financials are based on the most recent Mortgage that was taken out on this home.
Original Mortgage
$44,025
Interest Rate
8%
Mortgage Type
Seller Take Back
Purchase Details
Closed on
Sep 12, 2001
Sold by
Foreclosure 911 Inc
Bought by
Godsmark Charles
Purchase Details
Closed on
Jul 9, 2001
Sold by
Gehrke Harry C and Gehrke Bonnie H
Bought by
Foreclosure 911 Inc
Create a Home Valuation Report for This Property
The Home Valuation Report is an in-depth analysis detailing your home's value as well as a comparison with similar homes in the area
Home Values in the Area
Average Home Value in this Area
Purchase History
| Date | Buyer | Sale Price | Title Company |
|---|---|---|---|
| Witherspoon Charles H | $46,000 | -- | |
| Godsmark Charles | $25,000 | -- | |
| Foreclosure 911 Inc | $18,500 | -- |
Source: Public Records
Mortgage History
| Date | Status | Borrower | Loan Amount |
|---|---|---|---|
| Closed | Witherspoon Charles H | $44,025 |
Source: Public Records
Tax History
| Year | Tax Paid | Tax Assessment Tax Assessment Total Assessment is a certain percentage of the fair market value that is determined by local assessors to be the total taxable value of land and additions on the property. | Land | Improvement |
|---|---|---|---|---|
| 2025 | $3,394 | $61,200 | $12,700 | $48,500 |
| 2024 | $3,280 | $61,200 | $12,700 | $48,500 |
Source: Public Records
Map
Nearby Homes
- 59 61 Broad St
- 1 E Pitman St
- 18 Pearl St
- 15 E Griffith St
- 51 E Griffith St
- 99 N Virginia Ave
- 68 E Harmony St
- 71 Poplar St
- 54 W Pitman St
- 111 Grove St
- 87 W Pitman St
- 78 W Harmony St
- 0 Cumberland Ave
- 51 Washington Ave
- 242 N Broad St
- 244 N Broad St
- 110 W Harmony St
- 101 Penn St
- 0 Lincoln Avenue & Cumberland
- 81 7th Ave
Your Personal Tour Guide
Ask me questions while you tour the home.