Estimated Value: $623,000 - $693,000
4
Beds
2
Baths
2,446
Sq Ft
$272/Sq Ft
Est. Value
About This Home
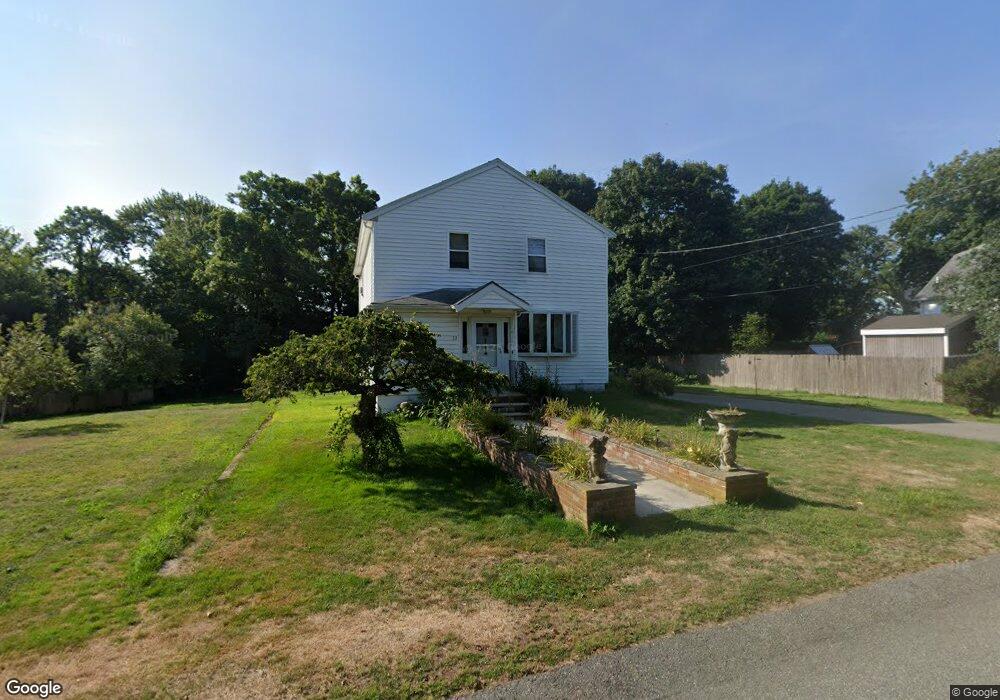
This home is located at 23 East St, Avon, MA 02322 and is currently estimated at $666,338, approximately $272 per square foot. 23 East St is a home located in Norfolk County with nearby schools including Ralph D. Butler Elementary School and Avon Middle/High School.
Ownership History
Date
Name
Owned For
Owner Type
Purchase Details
Closed on
Aug 25, 2008
Sold by
Est Ferrini Eleanor A and Grillone Jodi A
Bought by
Reed Constance A and Patricelli Pamela J
Current Estimated Value
Home Financials for this Owner
Home Financials are based on the most recent Mortgage that was taken out on this home.
Original Mortgage
$268,363
Outstanding Balance
$177,470
Interest Rate
6.4%
Mortgage Type
Purchase Money Mortgage
Estimated Equity
$488,868
Create a Home Valuation Report for This Property
The Home Valuation Report is an in-depth analysis detailing your home's value as well as a comparison with similar homes in the area
Home Values in the Area
Average Home Value in this Area
Purchase History
| Date | Buyer | Sale Price | Title Company |
|---|---|---|---|
| Reed Constance A | $279,000 | -- |
Source: Public Records
Mortgage History
| Date | Status | Borrower | Loan Amount |
|---|---|---|---|
| Open | Reed Constance A | $268,363 |
Source: Public Records
Tax History Compared to Growth
Tax History
| Year | Tax Paid | Tax Assessment Tax Assessment Total Assessment is a certain percentage of the fair market value that is determined by local assessors to be the total taxable value of land and additions on the property. | Land | Improvement |
|---|---|---|---|---|
| 2025 | $69 | $520,700 | $222,900 | $297,800 |
| 2024 | $6,424 | $457,900 | $202,100 | $255,800 |
| 2023 | $6,237 | $457,900 | $202,100 | $255,800 |
| 2022 | $6,250 | $395,300 | $168,500 | $226,800 |
| 2021 | $5,886 | $350,800 | $153,000 | $197,800 |
| 2020 | $6,262 | $353,800 | $149,900 | $203,900 |
| 2019 | $5,820 | $323,500 | $143,100 | $180,400 |
| 2018 | $6,001 | $323,500 | $143,100 | $180,400 |
| 2017 | $4,939 | $285,800 | $143,100 | $142,700 |
| 2016 | $5,003 | $292,400 | $136,400 | $156,000 |
| 2015 | $4,381 | $267,600 | $130,200 | $137,400 |
Source: Public Records
Map
Nearby Homes