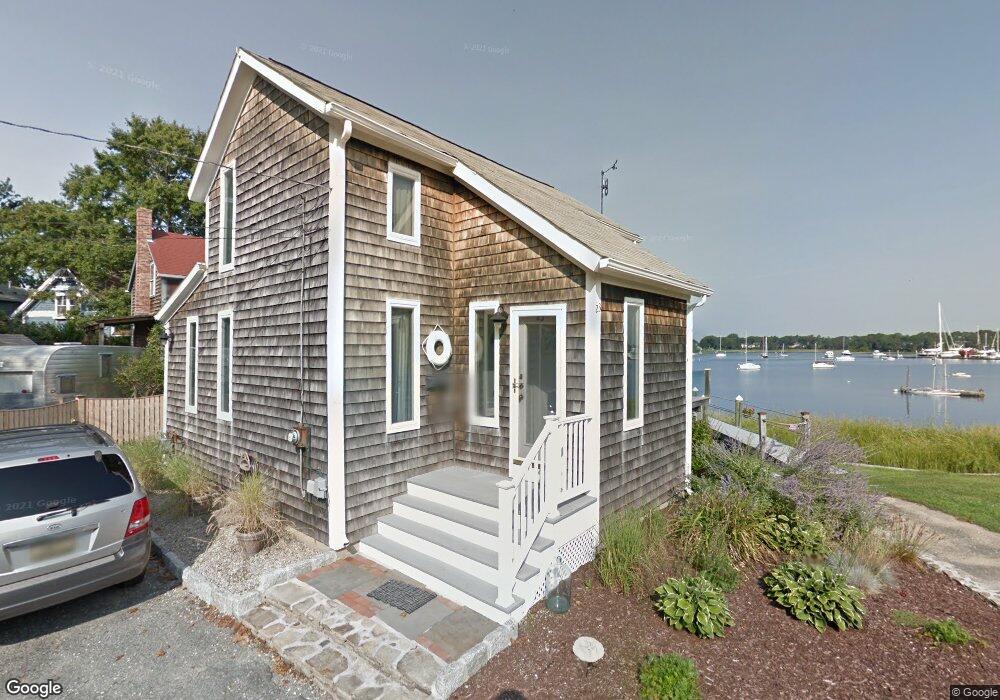
23 Edwin St Barrington, RI 02806
Bay Spring NeighborhoodEstimated Value: $544,000 - $763,379
2
Beds
2
Baths
1,256
Sq Ft
$515/Sq Ft
Est. Value
About This Home
This home is located at 23 Edwin St, Barrington, RI 02806 and is currently estimated at $646,595, approximately $514 per square foot. 23 Edwin St is a home located in Bristol County with nearby schools including Barrington High School, St Luke Elementary School, and Barrington Christian Academy.
Ownership History
Date
Name
Owned For
Owner Type
Purchase Details
Closed on
Dec 1, 2021
Sold by
Hannan William M and Hannan Sandra J
Bought by
William M Hannan Lt
Current Estimated Value
Purchase Details
Closed on
Mar 18, 2013
Sold by
Hannan Sandra J and Hannan William M
Bought by
Hannan Sandra J and Hannan William M
Create a Home Valuation Report for This Property
The Home Valuation Report is an in-depth analysis detailing your home's value as well as a comparison with similar homes in the area
Home Values in the Area
Average Home Value in this Area
Purchase History
| Date | Buyer | Sale Price | Title Company |
|---|---|---|---|
| William M Hannan Lt | -- | None Available | |
| Hannan William M | -- | None Available | |
| Hannan Sandra J | -- | -- |
Source: Public Records
Mortgage History
| Date | Status | Borrower | Loan Amount |
|---|---|---|---|
| Previous Owner | Hannan Sandra J | $47,000 |
Source: Public Records
Tax History
| Year | Tax Paid | Tax Assessment Tax Assessment Total Assessment is a certain percentage of the fair market value that is determined by local assessors to be the total taxable value of land and additions on the property. | Land | Improvement |
|---|---|---|---|---|
| 2025 | $10,891 | $710,000 | $422,000 | $288,000 |
| 2024 | $10,473 | $710,000 | $422,000 | $288,000 |
| 2023 | $9,582 | $472,000 | $316,000 | $156,000 |
| 2022 | $9,275 | $472,000 | $316,000 | $156,000 |
| 2021 | $9,039 | $472,000 | $316,000 | $156,000 |
| 2020 | $8,527 | $408,000 | $261,000 | $147,000 |
| 2019 | $8,201 | $408,000 | $261,000 | $147,000 |
| 2018 | $7,956 | $408,000 | $261,000 | $147,000 |
| 2017 | $8,894 | $444,700 | $247,200 | $197,500 |
| 2016 | $8,205 | $444,700 | $247,200 | $197,500 |
| 2015 | $8,116 | $444,700 | $247,200 | $197,500 |
| 2014 | $7,166 | $391,600 | $247,200 | $144,400 |
Source: Public Records
Map
Nearby Homes
- 9 Mystic Ave
- 71 Alfred Drown Rd
- 916 Bullocks Pt Ave
- 168 Washington Rd
- 0 Carousel Dr
- 45 Washington Rd
- 20 Townsend St
- 15 Claire St
- 150 Alfred Drowne Rd
- 236 Becker Ave
- 85 Hilton Ave
- 6 Conway Dr
- 29 N Lake Dr
- 41 White Ave
- 11 Elton Rd
- 79 Sherman St
- 14 Winthrop St
- 14 Benedict St
- 154 Lincoln Ave
- 56 Knowlton St
Your Personal Tour Guide
Ask me questions while you tour the home.