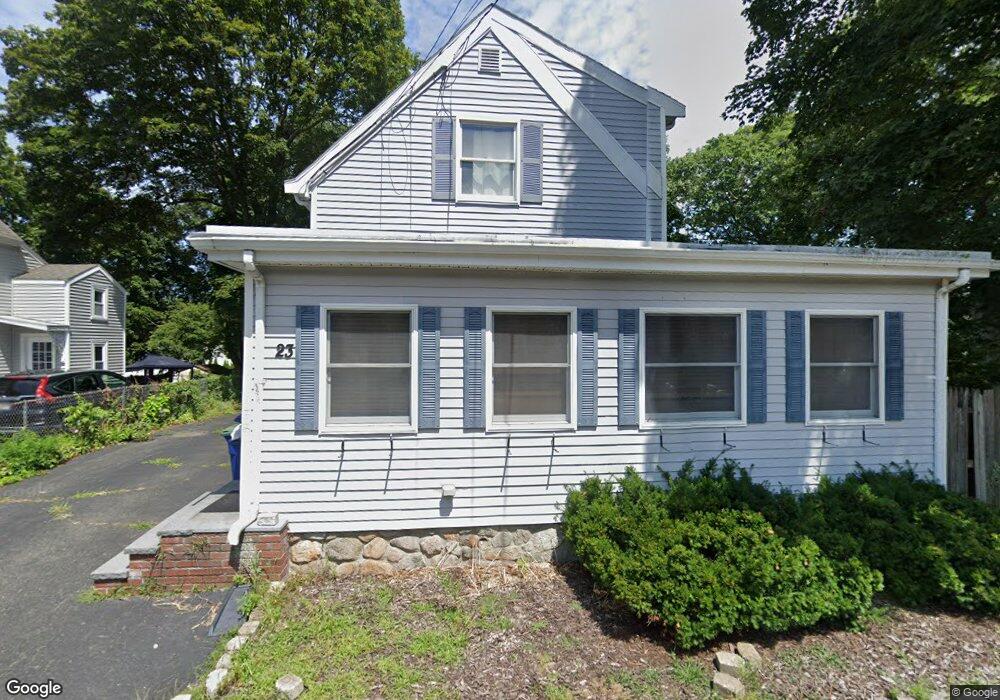
23 Elliot St Braintree, MA 02184
Weymouth Landing NeighborhoodEstimated Value: $661,081 - $766,000
3
Beds
2
Baths
1,811
Sq Ft
$389/Sq Ft
Est. Value
About This Home
This home is located at 23 Elliot St, Braintree, MA 02184 and is currently estimated at $704,520, approximately $389 per square foot. 23 Elliot St is a home located in Norfolk County with nearby schools including Braintree High School, Sacred Heart Elementary School, and South Shore Christian Academy.
Ownership History
Date
Name
Owned For
Owner Type
Purchase Details
Closed on
Aug 31, 2005
Sold by
Ctghreal Estate T and Walsh Sylvia
Bought by
Stoyanov Roumen and Koleva Violeta
Current Estimated Value
Home Financials for this Owner
Home Financials are based on the most recent Mortgage that was taken out on this home.
Original Mortgage
$280,000
Outstanding Balance
$149,424
Interest Rate
5.81%
Mortgage Type
Purchase Money Mortgage
Estimated Equity
$555,096
Create a Home Valuation Report for This Property
The Home Valuation Report is an in-depth analysis detailing your home's value as well as a comparison with similar homes in the area
Home Values in the Area
Average Home Value in this Area
Purchase History
| Date | Buyer | Sale Price | Title Company |
|---|---|---|---|
| Stoyanov Roumen | $350,000 | -- |
Source: Public Records
Mortgage History
| Date | Status | Borrower | Loan Amount |
|---|---|---|---|
| Open | Stoyanov Roumen | $280,000 | |
| Closed | Stoyanov Roumen | $52,500 |
Source: Public Records
Tax History
| Year | Tax Paid | Tax Assessment Tax Assessment Total Assessment is a certain percentage of the fair market value that is determined by local assessors to be the total taxable value of land and additions on the property. | Land | Improvement |
|---|---|---|---|---|
| 2025 | $5,820 | $583,200 | $324,100 | $259,100 |
| 2024 | $5,291 | $558,100 | $302,200 | $255,900 |
| 2023 | $5,008 | $513,100 | $271,600 | $241,500 |
| 2022 | $4,844 | $486,800 | $245,300 | $241,500 |
| 2021 | $4,464 | $448,600 | $221,600 | $227,000 |
| 2020 | $4,125 | $418,400 | $201,500 | $216,900 |
| 2019 | $3,991 | $395,500 | $192,700 | $202,800 |
| 2018 | $3,892 | $369,300 | $175,200 | $194,100 |
| 2017 | $3,747 | $348,900 | $166,400 | $182,500 |
| 2016 | $3,455 | $314,700 | $140,200 | $174,500 |
| 2015 | $3,392 | $306,400 | $138,400 | $168,000 |
| 2014 | $3,210 | $281,100 | $126,100 | $155,000 |
Source: Public Records
Map
Nearby Homes
- 122 Washington St Unit Twenty-two
- 15 Summer St
- 37 Lantern Ln
- 41 Lantern Ln
- 11 Richmond St
- 25 Richmond St
- 16 Lindbergh Ave
- 51 Faxon St
- 114 Broad St Unit D
- 107 Summer St
- 97 Liberty St
- 19 Vine St Unit 3
- 19 Vine St Unit 2
- 125 Allen St Unit A
- 33 Congress St
- 46 Roosevelt Rd
- 583 Union St
- 16 Beechwood Rd
- 82 Lester Ln
- 298 Lisle St
- 25-27 Elliot St
- 25 Elliot St Unit 27
- 19 Elliot St
- 29 Elliot St Unit 31
- 29-31 Elliot St
- 31 Elliot St Unit 31
- 38 Elmwood Park
- 28 Elmwood Park
- 15 Elliot St
- 22 Elliot St
- 22 Elmwood Park
- 24 Elliot St
- 44 Elmwood Park
- 18 Elliot St
- 26 Elliot St
- 18 Elmwood Park
- 32 Elliot St
- 14 Elliot St
- 36 Elliot St
- 12 Elliot St
Your Personal Tour Guide
Ask me questions while you tour the home.