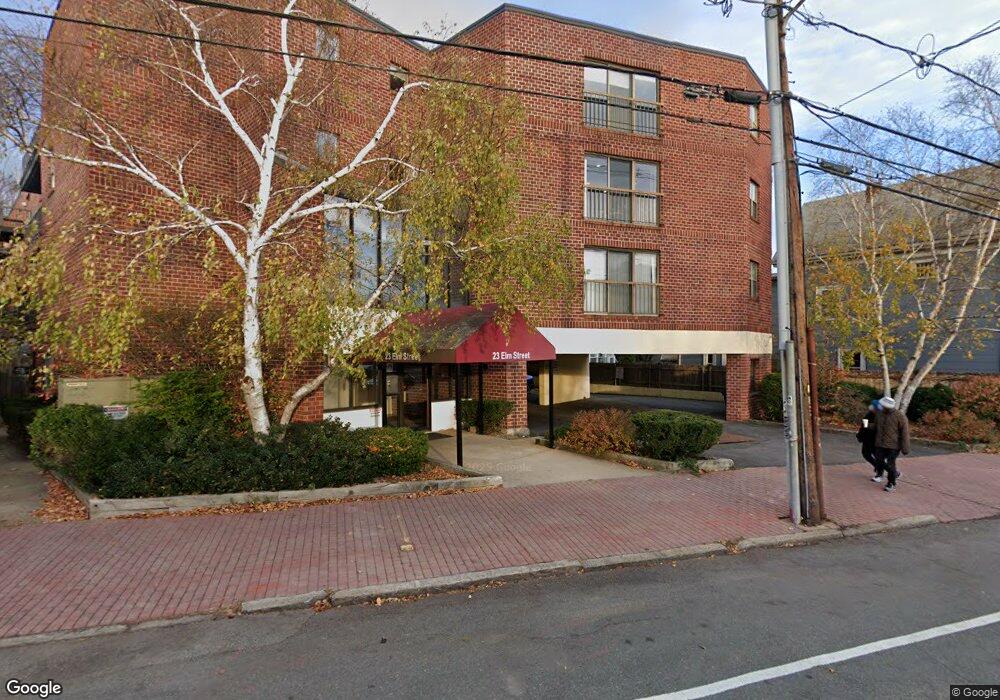
23 Elm St Unit 206 Somerville, MA 02143
Porter Square NeighborhoodEstimated Value: $761,164 - $927,000
2
Beds
2
Baths
1,200
Sq Ft
$694/Sq Ft
Est. Value
About This Home
This home is located at 23 Elm St Unit 206, Somerville, MA 02143 and is currently estimated at $832,541, approximately $693 per square foot. 23 Elm St Unit 206 is a home located in Middlesex County with nearby schools including Somerville High School, Saint Theresa School, and Wild Rose Montessori School.
Ownership History
Date
Name
Owned For
Owner Type
Purchase Details
Closed on
Jan 27, 2006
Sold by
Smit Pierre R
Bought by
Shek Kenny
Current Estimated Value
Home Financials for this Owner
Home Financials are based on the most recent Mortgage that was taken out on this home.
Original Mortgage
$270,000
Outstanding Balance
$153,257
Interest Rate
6.34%
Mortgage Type
Purchase Money Mortgage
Estimated Equity
$679,284
Purchase Details
Closed on
Jun 24, 2002
Sold by
Hughes Curtis K and Hughes Doria A
Bought by
Smit Pierre R
Home Financials for this Owner
Home Financials are based on the most recent Mortgage that was taken out on this home.
Original Mortgage
$300,700
Interest Rate
6.81%
Mortgage Type
Purchase Money Mortgage
Purchase Details
Closed on
Jun 12, 1998
Sold by
Bhatia Raj K and Bhatia Sadhna R
Bought by
Hughes Curtis K and Hughes Doria A
Home Financials for this Owner
Home Financials are based on the most recent Mortgage that was taken out on this home.
Original Mortgage
$95,000
Interest Rate
7.11%
Mortgage Type
Purchase Money Mortgage
Create a Home Valuation Report for This Property
The Home Valuation Report is an in-depth analysis detailing your home's value as well as a comparison with similar homes in the area
Home Values in the Area
Average Home Value in this Area
Purchase History
| Date | Buyer | Sale Price | Title Company |
|---|---|---|---|
| Shek Kenny | $360,000 | -- | |
| Smit Pierre R | $323,000 | -- | |
| Hughes Curtis K | $175,000 | -- |
Source: Public Records
Mortgage History
| Date | Status | Borrower | Loan Amount |
|---|---|---|---|
| Open | Shek Kenny | $270,000 | |
| Previous Owner | Smit Pierre R | $300,700 | |
| Previous Owner | Hughes Curtis K | $95,000 |
Source: Public Records
Tax History Compared to Growth
Tax History
| Year | Tax Paid | Tax Assessment Tax Assessment Total Assessment is a certain percentage of the fair market value that is determined by local assessors to be the total taxable value of land and additions on the property. | Land | Improvement |
|---|---|---|---|---|
| 2025 | $7,495 | $687,000 | $0 | $687,000 |
| 2024 | $7,403 | $703,700 | $0 | $703,700 |
| 2023 | $7,215 | $697,800 | $0 | $697,800 |
| 2022 | $6,786 | $666,600 | $0 | $666,600 |
| 2021 | $6,581 | $645,800 | $0 | $645,800 |
| 2020 | $6,456 | $639,800 | $0 | $639,800 |
| 2019 | $6,402 | $595,000 | $0 | $595,000 |
| 2018 | $6,059 | $535,700 | $0 | $535,700 |
| 2017 | $5,763 | $493,800 | $0 | $493,800 |
| 2016 | $5,462 | $435,900 | $0 | $435,900 |
| 2015 | $4,884 | $387,300 | $0 | $387,300 |
Source: Public Records
Map
Nearby Homes
- 749 Somerville Ave Unit 1
- 8 Craigie St
- 35 Ibbetson St
- 22 Lowell St Unit 3
- 42 Belmont St
- 85 Lowell St
- 32-40 White St
- 82 Sacramento St
- 125 Lowell St Unit 4C
- 125 Lowell St Unit 203
- 125 Lowell St Unit 5A
- 125 Lowell St Unit 301
- 125 Lowell St Unit 7B
- 125 Lowell St Unit 201
- 125 Lowell St Unit 503
- 125 Lowell St Unit 302
- 125 Lowell St Unit 402
- 125 Lowell St Unit 3C
- 125 Lowell St Unit 6A
- 3 Arlington St Unit 52
- 23 Elm St Unit 309
- 23 Elm St Unit 308
- 23 Elm St Unit 307
- 23 Elm St Unit 306
- 23 Elm St Unit 305
- 23 Elm St Unit 304
- 23 Elm St Unit 303
- 23 Elm St Unit 302
- 23 Elm St Unit 301
- 23 Elm St Unit 209
- 23 Elm St Unit 208
- 23 Elm St Unit 207
- 23 Elm St Unit 205
- 23 Elm St Unit 204
- 23 Elm St Unit 203
- 23 Elm St Unit 202
- 23 Elm St Unit 201
- 23 Elm St Unit 109
- 23 Elm St Unit 108
- 23 Elm St Unit 107