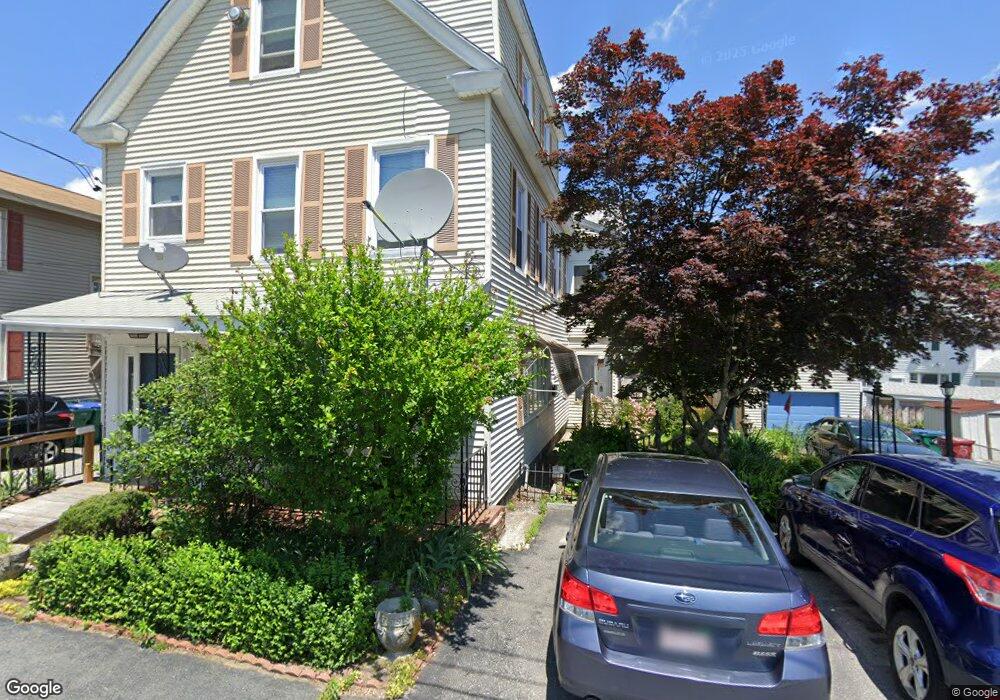
23 Endicott St Lowell, MA 01854
Pawtucketville NeighborhoodEstimated Value: $700,444 - $868,000
6
Beds
3
Baths
3,220
Sq Ft
$243/Sq Ft
Est. Value
About This Home
This home is located at 23 Endicott St, Lowell, MA 01854 and is currently estimated at $782,861, approximately $243 per square foot. 23 Endicott St is a home located in Middlesex County with nearby schools including Joseph McAvinnue Elementary School, Charlotte M. Murkland Elementary School, and Charles W. Morey Elementary School.
Ownership History
Date
Name
Owned For
Owner Type
Purchase Details
Closed on
Oct 30, 2023
Sold by
Gagnon Gerard L and Gagnon Claudette M
Bought by
Gagnon Ft and Robidas
Current Estimated Value
Purchase Details
Closed on
Jun 21, 1968
Bought by
Gagnon Gerard L and Gagnon Claudette M
Create a Home Valuation Report for This Property
The Home Valuation Report is an in-depth analysis detailing your home's value as well as a comparison with similar homes in the area
Home Values in the Area
Average Home Value in this Area
Purchase History
| Date | Buyer | Sale Price | Title Company |
|---|---|---|---|
| Gagnon Ft | -- | None Available | |
| Gagnon Ft | -- | None Available | |
| Gagnon Gerard L | $11,000 | -- |
Source: Public Records
Mortgage History
| Date | Status | Borrower | Loan Amount |
|---|---|---|---|
| Previous Owner | Gagnon Gerard L | $50,000 |
Source: Public Records
Tax History
| Year | Tax Paid | Tax Assessment Tax Assessment Total Assessment is a certain percentage of the fair market value that is determined by local assessors to be the total taxable value of land and additions on the property. | Land | Improvement |
|---|---|---|---|---|
| 2025 | $7,937 | $691,400 | $172,600 | $518,800 |
| 2024 | $7,256 | $609,200 | $150,500 | $458,700 |
| 2023 | $6,677 | $537,600 | $125,100 | $412,500 |
| 2022 | $6,180 | $487,000 | $113,700 | $373,300 |
| 2021 | $5,734 | $426,000 | $98,900 | $327,100 |
| 2020 | $5,265 | $394,100 | $92,400 | $301,700 |
| 2019 | $4,806 | $342,300 | $85,600 | $256,700 |
| 2018 | $4,484 | $311,600 | $81,500 | $230,100 |
| 2017 | $4,240 | $284,200 | $74,100 | $210,100 |
| 2016 | $4,067 | $268,300 | $62,100 | $206,200 |
| 2015 | $3,771 | $243,600 | $63,500 | $180,100 |
| 2013 | $3,466 | $230,900 | $78,400 | $152,500 |
Source: Public Records
Map
Nearby Homes
- 244 White St
- 39 Phoebe Ave
- 28 Sarah Ave
- 49 Sparks St
- 30 4th Ave
- 94 Hampson St
- 89 Mammoth Rd
- 25 Shea St Unit 8
- 548 Fletcher St
- 25 W 5th Ave
- 45 Hoover St
- 79 School St Unit 3
- 169 Salem St
- 101 Donohue Rd Unit 19
- 63 Bowers St
- 75 Sladen St
- 16 Peabody Ave
- 113 School St Unit 12
- 70 Austin St Unit 15
- 57 Wannalancit St Unit 6
Your Personal Tour Guide
Ask me questions while you tour the home.