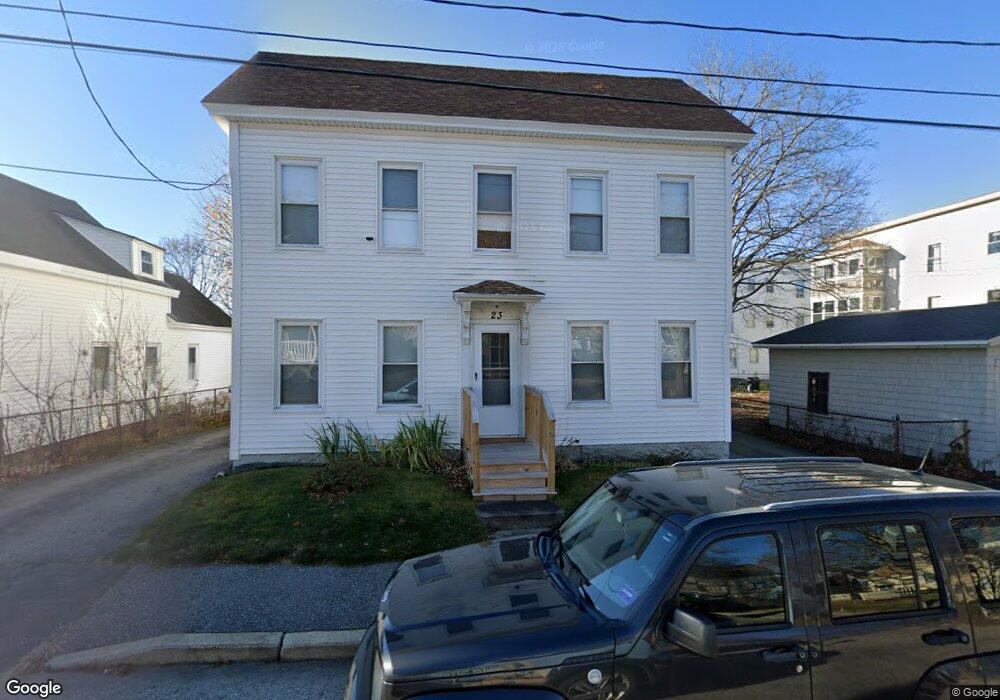
23 Fall St Biddeford, ME 04005
Estimated Value: $419,276 - $546,000
5
Beds
2
Baths
2,082
Sq Ft
$233/Sq Ft
Est. Value
About This Home
This home is located at 23 Fall St, Biddeford, ME 04005 and is currently estimated at $485,069, approximately $232 per square foot. 23 Fall St is a home located in York County with nearby schools including John F Kennedy Memorial School, Biddeford Primary School, and Biddeford Intermediate School.
Ownership History
Date
Name
Owned For
Owner Type
Purchase Details
Closed on
Dec 12, 2006
Sold by
Lavigne Kandice L
Bought by
Howard Richard D
Current Estimated Value
Home Financials for this Owner
Home Financials are based on the most recent Mortgage that was taken out on this home.
Original Mortgage
$182,156
Interest Rate
6.4%
Mortgage Type
Purchase Money Mortgage
Create a Home Valuation Report for This Property
The Home Valuation Report is an in-depth analysis detailing your home's value as well as a comparison with similar homes in the area
Home Values in the Area
Average Home Value in this Area
Purchase History
| Date | Buyer | Sale Price | Title Company |
|---|---|---|---|
| Howard Richard D | -- | -- |
Source: Public Records
Mortgage History
| Date | Status | Borrower | Loan Amount |
|---|---|---|---|
| Closed | Howard Richard D | $182,156 | |
| Closed | Howard Richard D | $60,719 |
Source: Public Records
Tax History
| Year | Tax Paid | Tax Assessment Tax Assessment Total Assessment is a certain percentage of the fair market value that is determined by local assessors to be the total taxable value of land and additions on the property. | Land | Improvement |
|---|---|---|---|---|
| 2024 | $4,428 | $311,400 | $125,200 | $186,200 |
| 2023 | $4,049 | $308,600 | $125,200 | $183,400 |
| 2022 | $3,389 | $206,500 | $68,900 | $137,600 |
| 2021 | $3,218 | $176,500 | $57,400 | $119,100 |
| 2020 | $2,993 | $149,300 | $48,800 | $100,500 |
| 2019 | $2,983 | $149,300 | $48,800 | $100,500 |
| 2018 | $2,941 | $149,300 | $48,800 | $100,500 |
| 2017 | $2,910 | $145,000 | $48,800 | $96,200 |
| 2016 | $2,880 | $145,000 | $48,800 | $96,200 |
| 2015 | $2,823 | $145,000 | $48,800 | $96,200 |
| 2014 | $2,754 | $145,000 | $48,800 | $96,200 |
| 2013 | -- | $184,200 | $63,900 | $120,300 |
Source: Public Records
Map
Nearby Homes
- 155 Hill St
- 109 Alfred St
- 17 Granite St
- 36-38 Pool St
- 5 Oak Place
- 11 King St
- 66 Graham St
- 12 Sheltra Ave
- 84 Pike St
- 7 Willett St
- 16 Hill St
- 4 Kossuth St
- 2 Main St Unit 15-311
- 2 Main St Unit 17-407
- 2 Main St Unit 15-502
- 2 Main St Unit 18-420
- 2 Main St Unit 17-416
- 2 Main St Unit 18-421
- 2 Main St Unit 15-509
- 2 Main St Unit 18-302
Your Personal Tour Guide
Ask me questions while you tour the home.