Estimated Value: $279,961 - $323,000
3
Beds
2
Baths
1,274
Sq Ft
$231/Sq Ft
Est. Value
About This Home
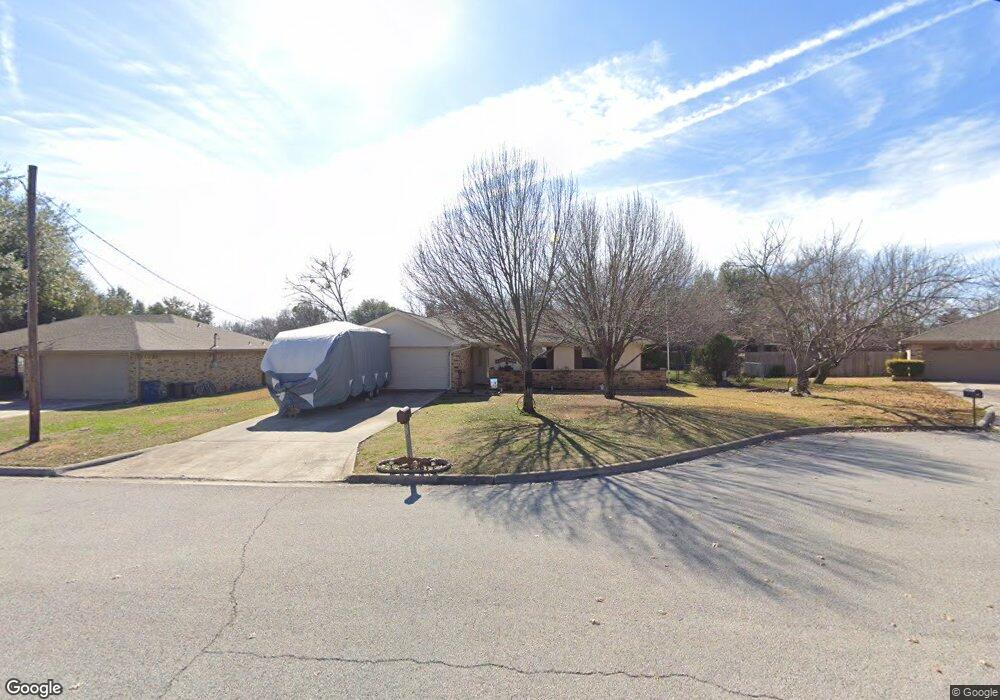
This home is located at 23 Finley Cir, Krum, TX 76249 and is currently estimated at $293,740, approximately $230 per square foot. 23 Finley Cir is a home located in Denton County with nearby schools including Krum Early Education Center, Dyer Elementary School, and Krum Middle School.
Ownership History
Date
Name
Owned For
Owner Type
Purchase Details
Closed on
Sep 3, 2013
Sold by
Jenkins Jody and Ragland Judy
Bought by
Phillips Shelley Kim
Current Estimated Value
Home Financials for this Owner
Home Financials are based on the most recent Mortgage that was taken out on this home.
Original Mortgage
$108,007
Outstanding Balance
$80,471
Interest Rate
4.36%
Mortgage Type
FHA
Estimated Equity
$213,269
Purchase Details
Closed on
Aug 30, 2013
Sold by
Gire Sonja June
Bought by
Jenkins Jody and Ragland Judy
Home Financials for this Owner
Home Financials are based on the most recent Mortgage that was taken out on this home.
Original Mortgage
$108,007
Outstanding Balance
$80,471
Interest Rate
4.36%
Mortgage Type
FHA
Estimated Equity
$213,269
Purchase Details
Closed on
May 2, 2013
Sold by
Gire Sonja June
Bought by
Jenkins Jody and Ragland Judy
Create a Home Valuation Report for This Property
The Home Valuation Report is an in-depth analysis detailing your home's value as well as a comparison with similar homes in the area
Home Values in the Area
Average Home Value in this Area
Purchase History
| Date | Buyer | Sale Price | Title Company |
|---|---|---|---|
| Phillips Shelley Kim | -- | None Available | |
| Jenkins Jody | -- | None Available | |
| Jenkins Jody | -- | None Available |
Source: Public Records
Mortgage History
| Date | Status | Borrower | Loan Amount |
|---|---|---|---|
| Open | Phillips Shelley Kim | $108,007 |
Source: Public Records
Tax History Compared to Growth
Tax History
| Year | Tax Paid | Tax Assessment Tax Assessment Total Assessment is a certain percentage of the fair market value that is determined by local assessors to be the total taxable value of land and additions on the property. | Land | Improvement |
|---|---|---|---|---|
| 2025 | $3,651 | $266,937 | $83,751 | $187,730 |
| 2024 | $4,890 | $242,670 | $0 | $0 |
| 2023 | $3,213 | $220,609 | $83,751 | $197,175 |
| 2022 | $4,600 | $200,554 | $60,630 | $180,091 |
| 2021 | $4,043 | $182,322 | $37,591 | $144,731 |
| 2020 | $4,000 | $176,649 | $37,591 | $139,058 |
| 2019 | $4,052 | $167,918 | $37,591 | $140,712 |
| 2018 | $3,702 | $152,653 | $37,591 | $121,656 |
| 2017 | $3,380 | $138,775 | $25,465 | $123,158 |
| 2016 | $2,981 | $126,159 | $25,465 | $104,113 |
| 2015 | $2,549 | $114,690 | $25,465 | $89,225 |
| 2014 | $2,549 | $113,022 | $25,465 | $87,557 |
| 2013 | -- | $93,282 | $25,465 | $67,817 |
Source: Public Records
Map
Nearby Homes
- 31 Rogers Cir
- TBD 5.3 ACRES Gregg Rd
- 2 Finley Cir
- 503 N 2nd St
- 407 Valley View Ln
- 342 W Huffman St
- 201 N 3rd St
- 511 W Lake St
- 220 Brook Cir
- Tbd 5 3 Acres Gregg Rd
- 102 Clearman St
- 1990
- 7257 Christina Ct
- 100 Turtle Dove
- 124 Fm 2450
- 7272 Christina Ct
- 1216 E 6th St
- 204 Cory Ct
- 198 Radecke Rd
- 8 S Sharon Dr