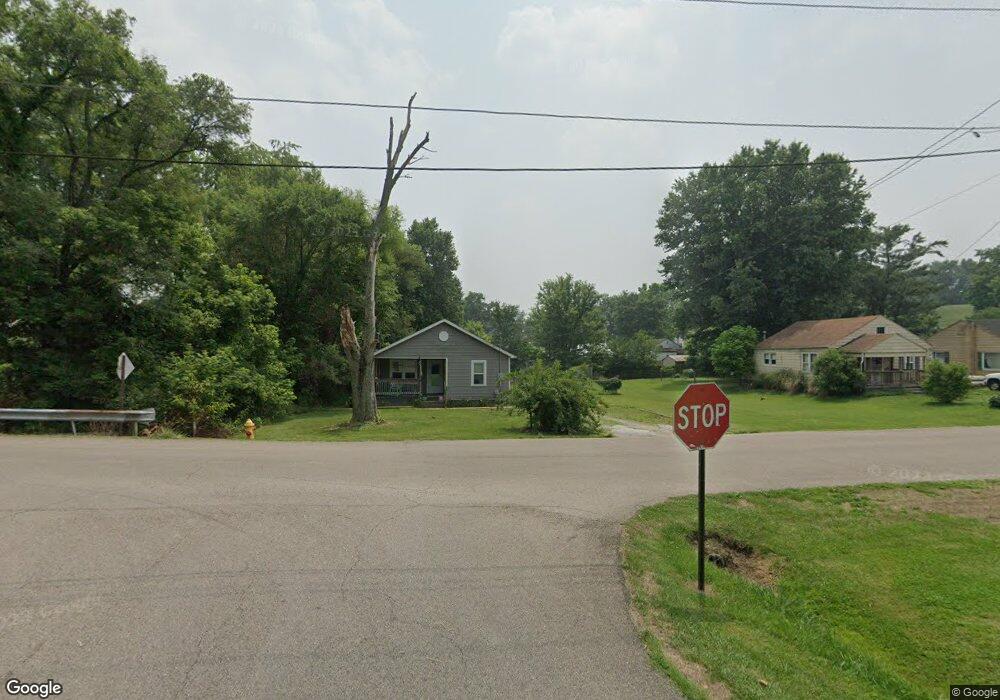
23 Fisher Dr Jackson, OH 45640
Estimated Value: $99,000 - $128,000
3
Beds
1
Bath
824
Sq Ft
$137/Sq Ft
Est. Value
About This Home
This home is located at 23 Fisher Dr, Jackson, OH 45640 and is currently estimated at $112,790, approximately $136 per square foot. 23 Fisher Dr is a home located in Jackson County with nearby schools including Jackson High School and Christian Life Academy.
Ownership History
Date
Name
Owned For
Owner Type
Purchase Details
Closed on
Sep 6, 2018
Sold by
Hughes Samantha and Hughes Edward Mason
Bought by
Miller Danielle E
Current Estimated Value
Home Financials for this Owner
Home Financials are based on the most recent Mortgage that was taken out on this home.
Original Mortgage
$57,181
Outstanding Balance
$49,870
Interest Rate
4.6%
Mortgage Type
New Conventional
Estimated Equity
$62,920
Purchase Details
Closed on
Nov 10, 2016
Sold by
Henderson Ed D and Henderson Marge A
Bought by
Hughes Samantha and Hughes Edward Mason
Home Financials for this Owner
Home Financials are based on the most recent Mortgage that was taken out on this home.
Original Mortgage
$43,345
Interest Rate
2.75%
Mortgage Type
FHA
Purchase Details
Closed on
Apr 1, 2011
Sold by
Priest Phyllis I and Priest Harold H
Bought by
Henderson Ed D and Henderson Marge A
Create a Home Valuation Report for This Property
The Home Valuation Report is an in-depth analysis detailing your home's value as well as a comparison with similar homes in the area
Home Values in the Area
Average Home Value in this Area
Purchase History
| Date | Buyer | Sale Price | Title Company |
|---|---|---|---|
| Miller Danielle E | $62,900 | Bestitle Agency Inc | |
| Hughes Samantha | $50,000 | Northwest Title | |
| Henderson Ed D | $9,000 | -- |
Source: Public Records
Mortgage History
| Date | Status | Borrower | Loan Amount |
|---|---|---|---|
| Open | Miller Danielle E | $57,181 | |
| Previous Owner | Hughes Samantha | $43,345 |
Source: Public Records
Tax History Compared to Growth
Tax History
| Year | Tax Paid | Tax Assessment Tax Assessment Total Assessment is a certain percentage of the fair market value that is determined by local assessors to be the total taxable value of land and additions on the property. | Land | Improvement |
|---|---|---|---|---|
| 2024 | $522 | $15,910 | $3,700 | $12,210 |
| 2023 | $549 | $15,910 | $3,700 | $12,210 |
| 2022 | $565 | $11,920 | $3,230 | $8,690 |
| 2021 | $442 | $11,920 | $3,230 | $8,690 |
| 2020 | $445 | $11,920 | $3,230 | $8,690 |
| 2019 | $433 | $11,380 | $3,080 | $8,300 |
| 2018 | $416 | $11,380 | $3,080 | $8,300 |
| 2017 | $430 | $11,380 | $3,080 | $8,300 |
| 2016 | $463 | $12,780 | $2,890 | $9,890 |
| 2015 | $466 | $12,780 | $2,890 | $9,890 |
| 2013 | $445 | $12,290 | $2,890 | $9,400 |
| 2012 | $452 | $12,290 | $2,890 | $9,400 |
Source: Public Records
Map
Nearby Homes
- 88 Taft St
- 15 Short St
- 44 E Vine St
- 9 E Vine St
- 5 W Coffman St
- 71 Buel Harris Rd
- 297 West St
- 92 W Main St
- 10933 Chillicothe Pike
- 152 E Main St
- 188 N Bennett Ave
- 387 E Broadway St
- 369 Portsmouth St
- 371 Portsmouth St
- 202 Columbia St
- 0 Main Place
- 76 West St
- 29 Carroll Ave
- 44 Portsmouth St
- 2485 Smith Bridge Rd