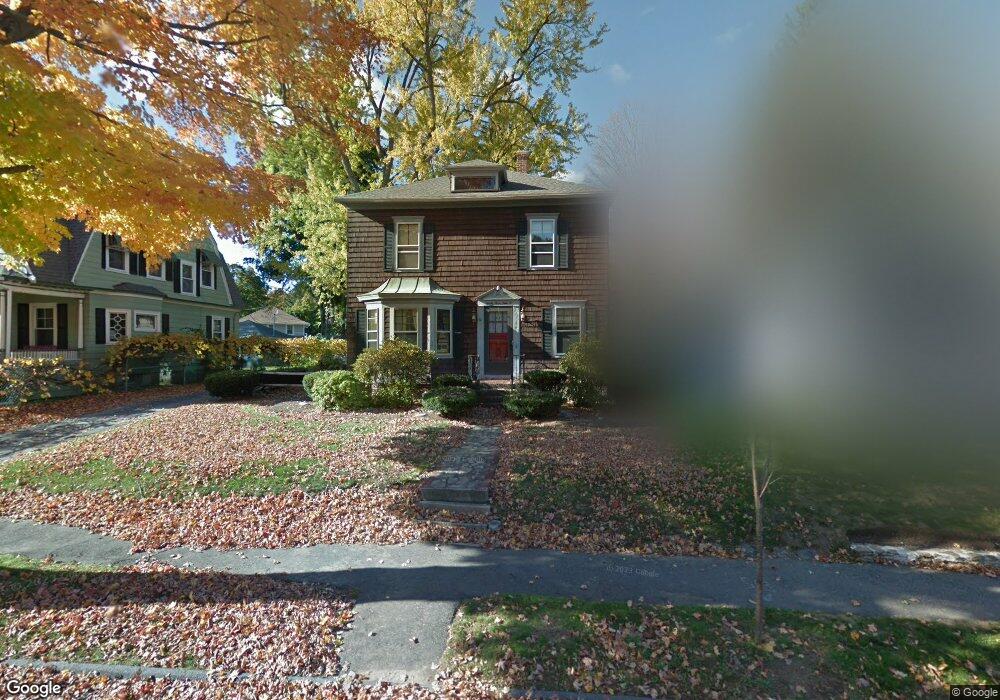
23 Fiske St Worcester, MA 01602
Newton Square NeighborhoodEstimated Value: $432,159 - $513,000
3
Beds
2
Baths
1,812
Sq Ft
$259/Sq Ft
Est. Value
About This Home
This home is located at 23 Fiske St, Worcester, MA 01602 and is currently estimated at $468,790, approximately $258 per square foot. 23 Fiske St is a home located in Worcester County with nearby schools including Chandler Magnet, Jacob Hiatt Magnet School, and May Street Elementary School.
Ownership History
Date
Name
Owned For
Owner Type
Purchase Details
Closed on
Jan 7, 2021
Sold by
Oneil-Powell Nancy E and Powell Gayous R
Bought by
Wasgatt Paul D
Current Estimated Value
Home Financials for this Owner
Home Financials are based on the most recent Mortgage that was taken out on this home.
Original Mortgage
$55,332
Outstanding Balance
$49,375
Interest Rate
2.7%
Mortgage Type
Purchase Money Mortgage
Estimated Equity
$419,415
Purchase Details
Closed on
Sep 29, 2020
Sold by
Oneil-Powell Nancy E
Bought by
Oneil-Powell Nancy E and Wasgatt Paul
Purchase Details
Closed on
May 18, 2009
Sold by
Oconnor Jane E
Bought by
Oneil Nancy E
Create a Home Valuation Report for This Property
The Home Valuation Report is an in-depth analysis detailing your home's value as well as a comparison with similar homes in the area
Home Values in the Area
Average Home Value in this Area
Purchase History
| Date | Buyer | Sale Price | Title Company |
|---|---|---|---|
| Wasgatt Paul D | $180,000 | None Available | |
| Oneil-Powell Nancy E | -- | None Available | |
| Oneil Nancy E | $122,500 | -- |
Source: Public Records
Mortgage History
| Date | Status | Borrower | Loan Amount |
|---|---|---|---|
| Open | Wasgatt Paul D | $55,332 |
Source: Public Records
Tax History Compared to Growth
Tax History
| Year | Tax Paid | Tax Assessment Tax Assessment Total Assessment is a certain percentage of the fair market value that is determined by local assessors to be the total taxable value of land and additions on the property. | Land | Improvement |
|---|---|---|---|---|
| 2025 | $4,904 | $371,800 | $118,100 | $253,700 |
| 2024 | $4,707 | $342,300 | $118,100 | $224,200 |
| 2023 | $4,514 | $314,800 | $102,700 | $212,100 |
| 2022 | $4,216 | $277,200 | $82,200 | $195,000 |
| 2021 | $4,171 | $256,200 | $65,700 | $190,500 |
| 2020 | $3,983 | $234,300 | $65,700 | $168,600 |
| 2019 | $3,832 | $212,900 | $59,100 | $153,800 |
| 2018 | $3,835 | $202,800 | $59,100 | $143,700 |
| 2017 | $3,679 | $191,400 | $59,100 | $132,300 |
| 2016 | $3,642 | $176,700 | $43,200 | $133,500 |
| 2015 | $3,546 | $176,700 | $43,200 | $133,500 |
| 2014 | $3,451 | $176,600 | $43,200 | $133,400 |
Source: Public Records
Map
Nearby Homes