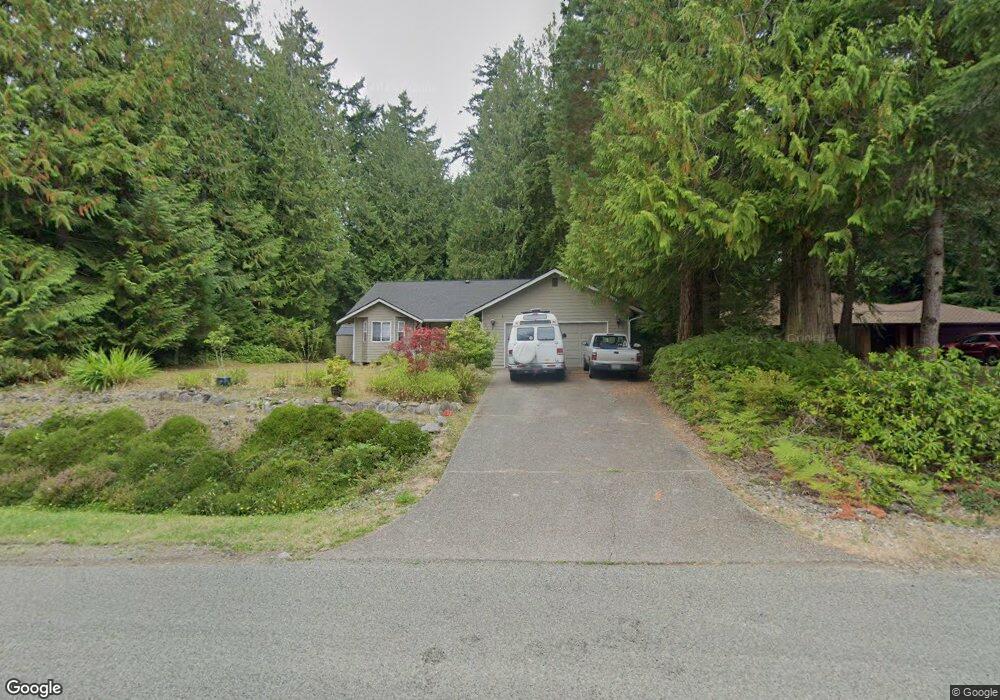
23 Fleet Dr Port Ludlow, WA 98365
Estimated Value: $501,000 - $553,000
3
Beds
2
Baths
1,616
Sq Ft
$324/Sq Ft
Est. Value
About This Home
This home is located at 23 Fleet Dr, Port Ludlow, WA 98365 and is currently estimated at $523,378, approximately $323 per square foot. 23 Fleet Dr is a home located in Jefferson County with nearby schools including Chimacum Creek Primary School, Chimacum School Pi Program, and Chimacum Elementary School.
Create a Home Valuation Report for This Property
The Home Valuation Report is an in-depth analysis detailing your home's value as well as a comparison with similar homes in the area
Home Values in the Area
Average Home Value in this Area
Tax History Compared to Growth
Tax History
| Year | Tax Paid | Tax Assessment Tax Assessment Total Assessment is a certain percentage of the fair market value that is determined by local assessors to be the total taxable value of land and additions on the property. | Land | Improvement |
|---|---|---|---|---|
| 2024 | $3,073 | $407,856 | $105,000 | $302,856 |
| 2023 | $3,073 | $385,237 | $95,000 | $290,237 |
| 2022 | $2,810 | $367,618 | $90,000 | $277,618 |
| 2021 | $2,708 | $304,335 | $71,500 | $232,835 |
| 2020 | $2,594 | $275,588 | $60,000 | $215,588 |
| 2019 | $2,466 | $253,341 | $55,000 | $198,341 |
| 2018 | $2,560 | $242,217 | $52,500 | $189,717 |
| 2017 | $2,432 | $222,470 | $50,000 | $172,470 |
| 2016 | $2,239 | $213,847 | $50,000 | $163,847 |
| 2015 | $2,236 | $194,364 | $60,088 | $134,276 |
| 2014 | -- | $194,364 | $60,088 | $134,276 |
| 2013 | -- | $169,010 | $52,250 | $116,760 |
Source: Public Records
Map
Nearby Homes
- 21 Camano Ln
- 270 Pioneer Dr
- 80 Harms Ln
- 231 Resolute Ln
- 37 Jackson Ln
- 61 Olympic Ln
- 72 Evans Ln
- 142 Resolute Ln
- 111 Jackson Ln
- 155 Baldwin Ln
- 82 Montgomery Ln
- 23 Machias Loop
- 270 Puget Loop
- 639 Rainier Ln
- 7251 Oak Bay Rd
- 140 Condon Ln
- 104 Puget Loop
- 91 Drew Ln
- 140 Admiralty Ln Unit 370
- 10 Olympic Place Unit 10