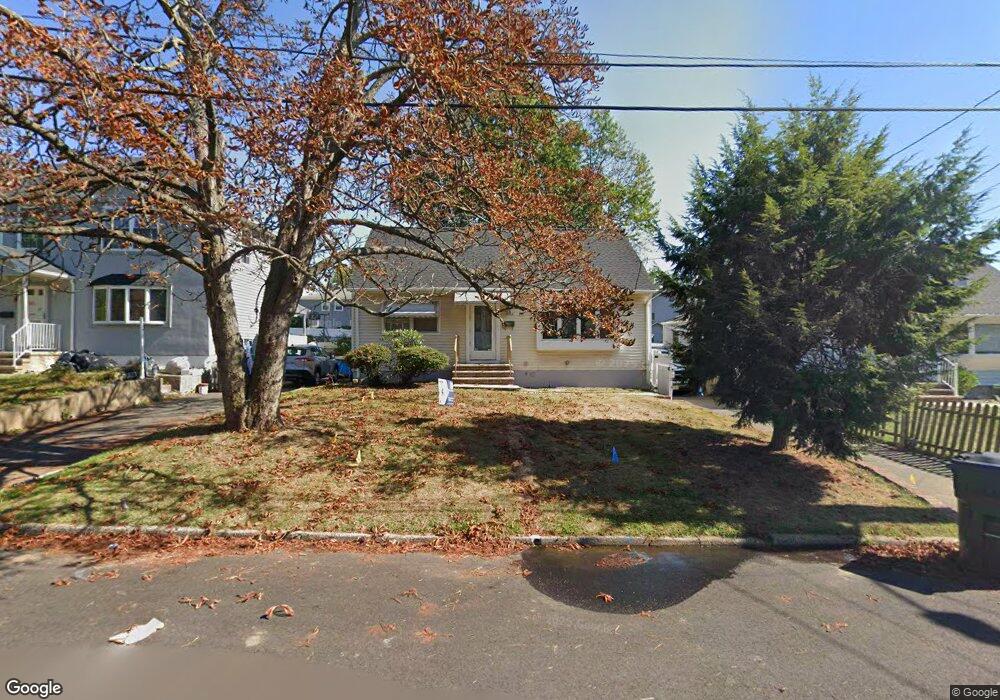
23 Forrest St Iselin, NJ 08830
Estimated Value: $310,434 - $578,000
Studio
--
Bath
816
Sq Ft
$575/Sq Ft
Est. Value
About This Home
This home is located at 23 Forrest St, Iselin, NJ 08830 and is currently estimated at $469,359, approximately $575 per square foot. 23 Forrest St is a home located in Middlesex County with nearby schools including Robert Mascenik School #26, Iselin Middle School, and John F. Kennedy Memorial High School.
Ownership History
Date
Name
Owned For
Owner Type
Purchase Details
Closed on
Apr 6, 2020
Sold by
Polera Anthony and Polera Nahed
Bought by
Polera Nahed
Current Estimated Value
Purchase Details
Closed on
Nov 23, 1993
Sold by
Scht Donald
Bought by
Polera Anthony and Polera Nahed
Home Financials for this Owner
Home Financials are based on the most recent Mortgage that was taken out on this home.
Original Mortgage
$149,000
Interest Rate
6.69%
Mortgage Type
FHA
Create a Home Valuation Report for This Property
The Home Valuation Report is an in-depth analysis detailing your home's value as well as a comparison with similar homes in the area
Home Values in the Area
Average Home Value in this Area
Purchase History
| Date | Buyer | Sale Price | Title Company |
|---|---|---|---|
| Polera Nahed | -- | None Available | |
| Polera Anthony | $150,500 | -- |
Source: Public Records
Mortgage History
| Date | Status | Borrower | Loan Amount |
|---|---|---|---|
| Closed | Polera Anthony | $149,000 |
Source: Public Records
Tax History
| Year | Tax Paid | Tax Assessment Tax Assessment Total Assessment is a certain percentage of the fair market value that is determined by local assessors to be the total taxable value of land and additions on the property. | Land | Improvement |
|---|---|---|---|---|
| 2025 | $8,712 | $74,400 | $20,000 | $54,400 |
| 2024 | $8,515 | $74,400 | $20,000 | $54,400 |
| 2023 | $8,515 | $74,400 | $20,000 | $54,400 |
| 2022 | $8,297 | $74,400 | $20,000 | $54,400 |
| 2021 | $8,228 | $74,400 | $20,000 | $54,400 |
| 2020 | $8,217 | $74,400 | $20,000 | $54,400 |
| 2019 | $8,022 | $74,400 | $20,000 | $54,400 |
| 2018 | $7,862 | $74,400 | $20,000 | $54,400 |
| 2017 | $7,723 | $74,400 | $20,000 | $54,400 |
| 2016 | $7,668 | $74,400 | $20,000 | $54,400 |
| 2015 | $7,530 | $74,400 | $20,000 | $54,400 |
| 2014 | $7,365 | $74,400 | $20,000 | $54,400 |
Source: Public Records
Map
Nearby Homes
- 137 Cooper Ave
- 35 Berkley Blvd
- 34 N Juliet St
- 281 Middlesex Turnpike
- 99 Elmhurst Ave
- 55 Gill Ln Unit 54
- 55 Gill Ln Unit 31
- 28 Silzer Ave
- 19 Claudia St
- 9 Holly Rd
- 24 Maple Rd
- 1031 Woodruff St
- 147 Warwick St
- 22 N Oak Ave
- 145 Creemer Ave
- 188 Bloomfield Ave
- 90 S Hyde Ave
- 27 Eagle St
- 323 Gill Ln Unit 11C
- 29 Park Ave
Your Personal Tour Guide
Ask me questions while you tour the home.