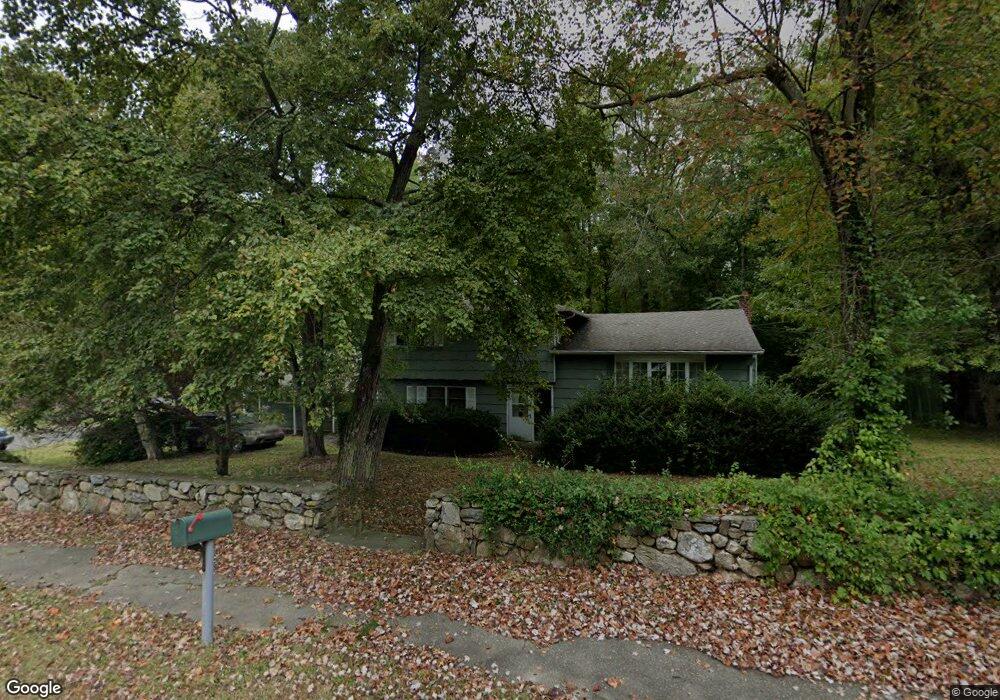
23 Fox Run Rd Norwalk, CT 06850
West Norwalk NeighborhoodEstimated Value: $449,000 - $934,206
4
Beds
2
Baths
1,534
Sq Ft
$489/Sq Ft
Est. Value
About This Home
This home is located at 23 Fox Run Rd, Norwalk, CT 06850 and is currently estimated at $749,802, approximately $488 per square foot. 23 Fox Run Rd is a home located in Fairfield County with nearby schools including Fox Run Elementary School, Ponus Ridge Middle School, and Brien Mcmahon High School.
Ownership History
Date
Name
Owned For
Owner Type
Purchase Details
Closed on
Nov 7, 2022
Sold by
Ashman Enos R Est and Samoksa
Bought by
Ashman Jeffrey R and Ashman Tracie L
Current Estimated Value
Home Financials for this Owner
Home Financials are based on the most recent Mortgage that was taken out on this home.
Original Mortgage
$324,000
Outstanding Balance
$312,238
Interest Rate
6.92%
Mortgage Type
Purchase Money Mortgage
Estimated Equity
$437,564
Purchase Details
Closed on
Dec 24, 1992
Sold by
Samoska Charmaigne
Bought by
Ashman Roy
Home Financials for this Owner
Home Financials are based on the most recent Mortgage that was taken out on this home.
Original Mortgage
$75,000
Interest Rate
8.31%
Mortgage Type
Purchase Money Mortgage
Create a Home Valuation Report for This Property
The Home Valuation Report is an in-depth analysis detailing your home's value as well as a comparison with similar homes in the area
Home Values in the Area
Average Home Value in this Area
Purchase History
| Date | Buyer | Sale Price | Title Company |
|---|---|---|---|
| Ashman Jeffrey R | $360,000 | None Available | |
| Ashman Jeffrey R | $360,000 | None Available | |
| Ashman Jeffrey R | $360,000 | None Available | |
| Ashman Roy | $32,000 | -- | |
| Ashman Roy | $32,000 | -- |
Source: Public Records
Mortgage History
| Date | Status | Borrower | Loan Amount |
|---|---|---|---|
| Open | Ashman Jeffrey R | $324,000 | |
| Closed | Ashman Jeffrey R | $324,000 | |
| Previous Owner | Ashman Roy | $575,000 | |
| Previous Owner | Ashman Roy | $75,000 |
Source: Public Records
Tax History
| Year | Tax Paid | Tax Assessment Tax Assessment Total Assessment is a certain percentage of the fair market value that is determined by local assessors to be the total taxable value of land and additions on the property. | Land | Improvement |
|---|---|---|---|---|
| 2025 | $12,292 | $513,320 | $223,410 | $289,910 |
| 2024 | $12,110 | $513,320 | $223,410 | $289,910 |
| 2023 | $9,498 | $377,490 | $188,660 | $188,830 |
| 2022 | $9,321 | $377,490 | $188,660 | $188,830 |
| 2021 | $9,079 | $377,490 | $188,660 | $188,830 |
| 2020 | $9,074 | $377,490 | $188,660 | $188,830 |
| 2019 | $8,820 | $377,490 | $188,660 | $188,830 |
| 2018 | $9,122 | $342,120 | $215,060 | $127,060 |
| 2017 | $8,808 | $342,120 | $215,060 | $127,060 |
| 2016 | $8,757 | $343,420 | $215,060 | $128,360 |
| 2015 | $8,700 | $342,120 | $215,060 | $127,060 |
| 2014 | $8,587 | $342,120 | $215,060 | $127,060 |
Source: Public Records
Map
Nearby Homes
- 1 Douglas Dr
- 2 Fox Run Rd
- 150 Fillow St
- 37 Glen Ave
- 45 Princes Pine Rd
- 58 Old Rock Ln
- 115 Fillow St Unit 3
- 4 Nursery St
- 201 W Norwalk Rd
- 10 Purdy Rd
- 5 Tower Dr
- 33 Purdy Rd E
- 192 Gillies Ln
- 7 Tommys Ln
- 41 Nash Place Unit B
- 29 Nash Place
- 75 N Taylor Ave
- 10 Ledgebrook Dr Unit 1
- 20 Marianne Rd
- 5 Lakeview Dr
- 8 Huckleberry Dr S
- 24 Fox Run Rd
- 5 Huckleberry Dr S
- 20 Fox Run Rd
- 21 Fox Run Rd
- 27 Fox Run Rd
- 3 Huckleberry Dr S
- 7 Huckleberry Dr S
- 5 Redcoat Rd
- 10 Huckleberry Dr S
- 9 Huckleberry Dr S
- 29 Fox Run Rd
- 7 Redcoat Rd
- 2 Douglas Dr
- 14 Fox Run Rd
- 31 Fox Run Rd
- 29 1/2 Fox Run Rd
- 11 Huckleberry Dr S
- 4 Redcoat Rd
- 30 Fox Run Rd
Your Personal Tour Guide
Ask me questions while you tour the home.