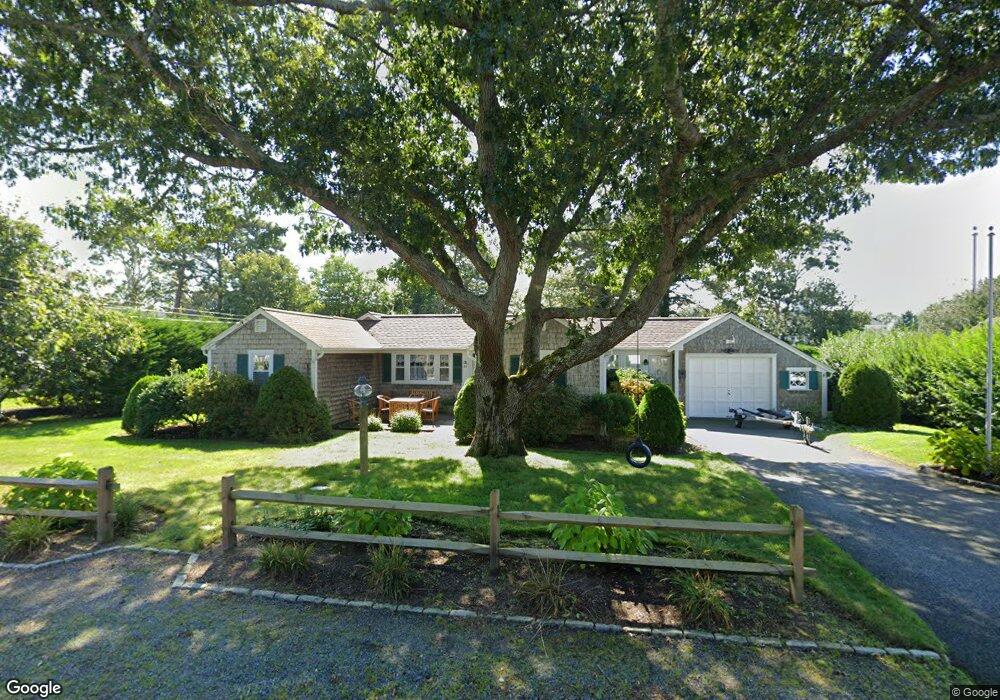
23 Garfield Ln West Dennis, MA 02670
West Dennis NeighborhoodEstimated Value: $687,000 - $1,370,000
3
Beds
2
Baths
1,001
Sq Ft
$944/Sq Ft
Est. Value
About This Home
This home is located at 23 Garfield Ln, West Dennis, MA 02670 and is currently estimated at $944,484, approximately $943 per square foot. 23 Garfield Ln is a home located in Barnstable County with nearby schools including Dennis-Yarmouth Regional High School and St. Pius X. School.
Ownership History
Date
Name
Owned For
Owner Type
Purchase Details
Closed on
Jul 31, 2019
Sold by
Langille David B and Langille Colleen A
Bought by
David B Langille Ret
Current Estimated Value
Purchase Details
Closed on
Jun 14, 1995
Sold by
Merna Paul J and Merna Anne E
Bought by
Langille David B and Langille Colleen A
Home Financials for this Owner
Home Financials are based on the most recent Mortgage that was taken out on this home.
Original Mortgage
$103,200
Interest Rate
8.24%
Mortgage Type
Purchase Money Mortgage
Purchase Details
Closed on
Feb 24, 1995
Sold by
Scott Harry B and Scott Ethel L
Bought by
Merna Paul J and Merna Anne E
Home Financials for this Owner
Home Financials are based on the most recent Mortgage that was taken out on this home.
Original Mortgage
$112,500
Interest Rate
9.17%
Mortgage Type
Purchase Money Mortgage
Create a Home Valuation Report for This Property
The Home Valuation Report is an in-depth analysis detailing your home's value as well as a comparison with similar homes in the area
Home Values in the Area
Average Home Value in this Area
Purchase History
| Date | Buyer | Sale Price | Title Company |
|---|---|---|---|
| David B Langille Ret | -- | -- | |
| Langille David B | $129,000 | -- | |
| Merna Paul J | $125,000 | -- |
Source: Public Records
Mortgage History
| Date | Status | Borrower | Loan Amount |
|---|---|---|---|
| Previous Owner | Merna Paul J | $79,800 | |
| Previous Owner | Merna Paul J | $103,200 | |
| Previous Owner | Merna Paul J | $112,500 |
Source: Public Records
Tax History Compared to Growth
Tax History
| Year | Tax Paid | Tax Assessment Tax Assessment Total Assessment is a certain percentage of the fair market value that is determined by local assessors to be the total taxable value of land and additions on the property. | Land | Improvement |
|---|---|---|---|---|
| 2025 | $3,930 | $907,700 | $531,600 | $376,100 |
| 2024 | $3,747 | $853,600 | $511,200 | $342,400 |
| 2023 | $3,624 | $776,100 | $464,700 | $311,400 |
| 2022 | $3,390 | $605,400 | $376,800 | $228,600 |
| 2021 | $2,108 | $558,500 | $369,400 | $189,100 |
| 2020 | $3,194 | $523,600 | $351,800 | $171,800 |
| 2019 | $3,150 | $510,500 | $344,900 | $165,600 |
| 2018 | $1,875 | $480,900 | $328,300 | $152,600 |
| 2017 | $2,929 | $476,200 | $328,300 | $147,900 |
| 2016 | $3,076 | $471,100 | $344,700 | $126,400 |
| 2015 | $3,015 | $471,100 | $344,700 | $126,400 |
| 2014 | $2,818 | $443,800 | $317,400 | $126,400 |
Source: Public Records
Map
Nearby Homes
- 2 Rita Mary Way
- 181 Pleasant St
- 308 Old Main St
- 14 Schoolhouse Ln
- 209 Main St Unit 3
- 209 Main St Unit 6
- 209 Main St Unit 1
- 209 Main St Unit 2
- 209 Main St Unit 4
- 209 Main St Unit 5
- 745 Willow St
- 45 Seth Ln
- 40 Kelley Rd
- 178 School St
- 23 Doric Ave
- 22 Powhatan Rd
- 17 South St
- 29 Bass River Rd
- 15 Sharon Rd
- 401 Main St Unit 201