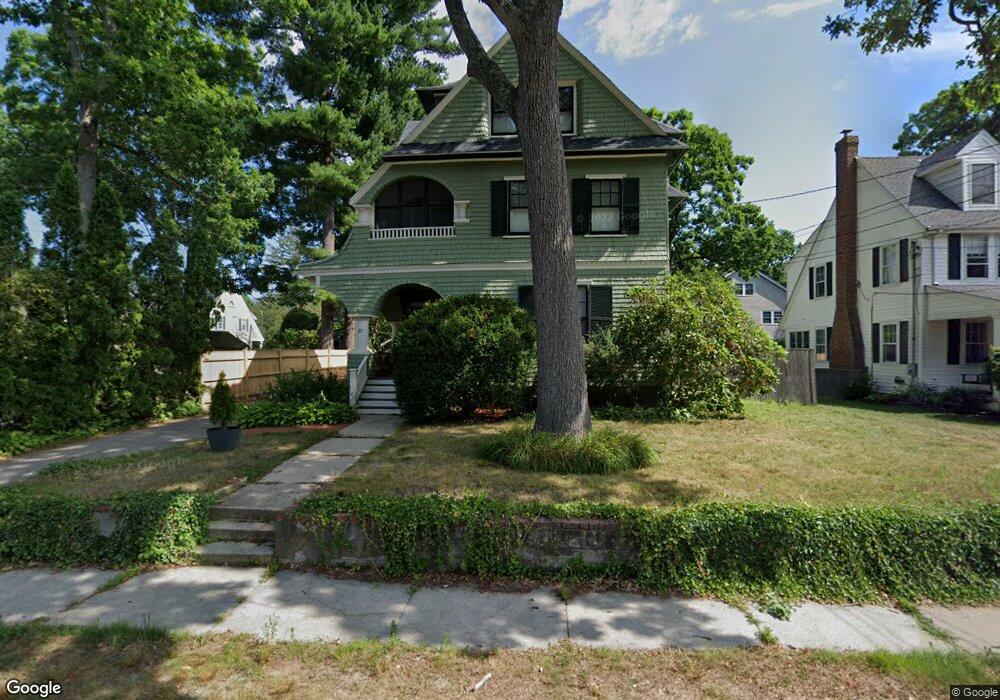
23 Gordon Rd Needham, MA 02492
Estimated Value: $1,403,000 - $1,595,088
5
Beds
2
Baths
1,119
Sq Ft
$1,337/Sq Ft
Est. Value
About This Home
This home is located at 23 Gordon Rd, Needham, MA 02492 and is currently estimated at $1,496,272, approximately $1,337 per square foot. 23 Gordon Rd is a home located in Norfolk County with nearby schools including Broadmeadow Elementary School, High Rock Middle School, and Pollard Middle School.
Ownership History
Date
Name
Owned For
Owner Type
Purchase Details
Closed on
Dec 17, 1996
Sold by
Barrett Veronica M
Bought by
Gannon George J and Gannon Muriel J
Current Estimated Value
Home Financials for this Owner
Home Financials are based on the most recent Mortgage that was taken out on this home.
Original Mortgage
$200,000
Interest Rate
7.75%
Mortgage Type
Purchase Money Mortgage
Create a Home Valuation Report for This Property
The Home Valuation Report is an in-depth analysis detailing your home's value as well as a comparison with similar homes in the area
Home Values in the Area
Average Home Value in this Area
Purchase History
| Date | Buyer | Sale Price | Title Company |
|---|---|---|---|
| Gannon George J | $350,500 | -- |
Source: Public Records
Mortgage History
| Date | Status | Borrower | Loan Amount |
|---|---|---|---|
| Open | Gannon George J | $194,000 | |
| Closed | Gannon George J | $200,000 | |
| Closed | Gannon George J | $245,000 | |
| Previous Owner | Gannon George J | $40,000 |
Source: Public Records
Tax History
| Year | Tax Paid | Tax Assessment Tax Assessment Total Assessment is a certain percentage of the fair market value that is determined by local assessors to be the total taxable value of land and additions on the property. | Land | Improvement |
|---|---|---|---|---|
| 2025 | $12,020 | $1,134,000 | $780,400 | $353,600 |
| 2024 | $12,585 | $1,005,200 | $597,700 | $407,500 |
| 2023 | $12,644 | $969,600 | $597,700 | $371,900 |
| 2022 | $12,173 | $910,500 | $548,400 | $362,100 |
| 2021 | $11,864 | $910,500 | $548,400 | $362,100 |
| 2020 | $11,403 | $913,000 | $548,800 | $364,200 |
| 2019 | $10,642 | $858,900 | $498,900 | $360,000 |
| 2018 | $10,204 | $858,900 | $498,900 | $360,000 |
| 2017 | $9,674 | $813,600 | $498,900 | $314,700 |
| 2016 | $9,432 | $817,300 | $498,900 | $318,400 |
| 2015 | $9,227 | $817,300 | $498,900 | $318,400 |
| 2014 | $9,169 | $787,700 | $473,700 | $314,000 |
Source: Public Records
Map
Nearby Homes
- 100 Bradford St
- 971 Webster St
- 68 Pleasant St Unit 68
- 233 Warren St
- 1011 Webster St
- 60 Sutton Rd
- 36 Otis St Unit 36
- 90 Norfolk St
- 126 Prince St
- 150 Laurel Dr
- 73 Maple St Unit 1
- 193 Garden St
- 19 Highland Ct Unit 19
- 19 Oakland Ave Unit 19
- 638 Webster St
- 638 Webster St Unit 638
- 31 Birds Hill Ave
- 47 Emerson Rd
- 569 Chestnut St
- 287 High Rock St
Your Personal Tour Guide
Ask me questions while you tour the home.