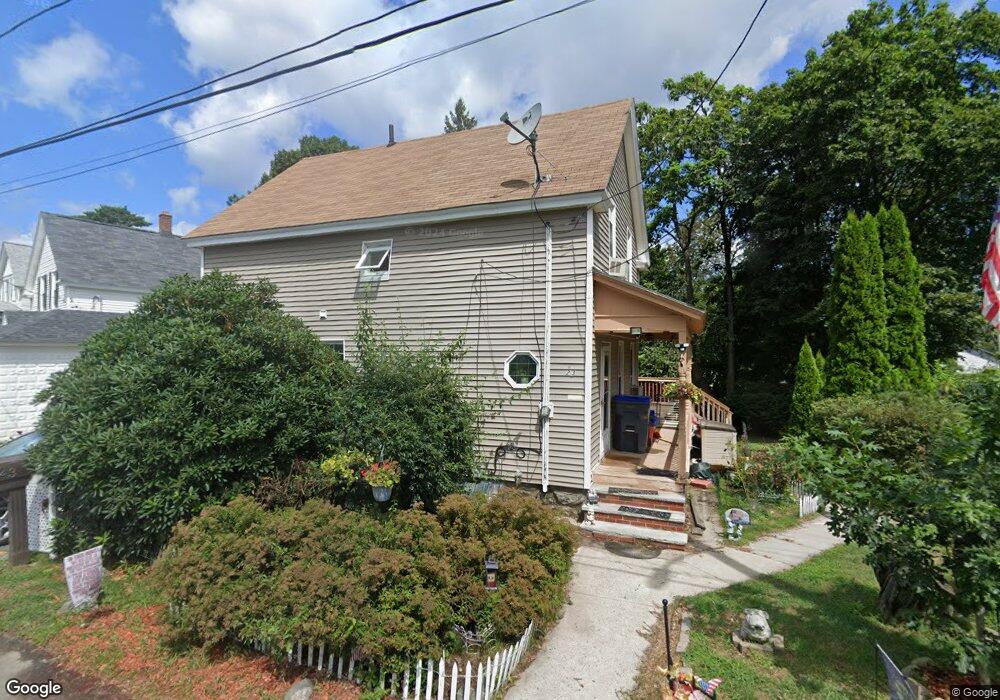
23 Grove St Methuen, MA 01844
Downtown Methuen NeighborhoodEstimated Value: $472,000 - $535,000
3
Beds
1
Bath
1,183
Sq Ft
$418/Sq Ft
Est. Value
About This Home
This home is located at 23 Grove St, Methuen, MA 01844 and is currently estimated at $494,902, approximately $418 per square foot. 23 Grove St is a home located in Essex County with nearby schools including Marsh Grammar School, Methuen High School, and The Islamic Academy For Peace.
Ownership History
Date
Name
Owned For
Owner Type
Purchase Details
Closed on
Jun 27, 1991
Sold by
Freeman Carol A
Bought by
Mammino David A
Current Estimated Value
Home Financials for this Owner
Home Financials are based on the most recent Mortgage that was taken out on this home.
Original Mortgage
$100,000
Interest Rate
9.44%
Mortgage Type
Purchase Money Mortgage
Create a Home Valuation Report for This Property
The Home Valuation Report is an in-depth analysis detailing your home's value as well as a comparison with similar homes in the area
Home Values in the Area
Average Home Value in this Area
Purchase History
| Date | Buyer | Sale Price | Title Company |
|---|---|---|---|
| Mammino David A | $108,000 | -- | |
| Mammino David A | $108,000 | -- |
Source: Public Records
Mortgage History
| Date | Status | Borrower | Loan Amount |
|---|---|---|---|
| Closed | Mammino David A | $100,000 | |
| Previous Owner | Mammino David A | $22,500 | |
| Previous Owner | Mammino David A | $65,000 |
Source: Public Records
Tax History
| Year | Tax Paid | Tax Assessment Tax Assessment Total Assessment is a certain percentage of the fair market value that is determined by local assessors to be the total taxable value of land and additions on the property. | Land | Improvement |
|---|---|---|---|---|
| 2025 | $4,433 | $419,000 | $201,200 | $217,800 |
| 2024 | $4,216 | $388,200 | $175,900 | $212,300 |
| 2023 | $4,035 | $344,900 | $154,800 | $190,100 |
| 2022 | $3,770 | $288,900 | $126,600 | $162,300 |
| 2021 | $3,543 | $268,600 | $119,600 | $149,000 |
| 2020 | $3,520 | $261,900 | $119,600 | $142,300 |
| 2019 | $3,413 | $240,500 | $112,600 | $127,900 |
| 2018 | $3,239 | $227,000 | $105,500 | $121,500 |
| 2017 | $3,060 | $208,900 | $98,500 | $110,400 |
| 2016 | $2,956 | $199,600 | $91,500 | $108,100 |
| 2015 | $2,850 | $195,200 | $91,500 | $103,700 |
Source: Public Records
Map
Nearby Homes
- 25 Grove St
- 21 Grove St
- 27 Grove St
- 19 Grove St Unit 7
- 19 Grove St Unit 12
- 19 Grove St Unit 13
- 19 Grove St Unit 9
- 19 Grove St Unit 6
- 19 Grove St
- 19 Grove St Unit 11
- 19 Grove St Unit 16
- 74 1/2 Union St
- 31 Grove St
- 78 Union St Unit 1
- 78 Union St Unit 2
- 78 Union St
- 70 Union St Unit 13
- 70 Union St Unit 8
- 70 Union St Unit 11
- 70 Union St Unit 5